. 2024 Sep 13;15(1):8036.
doi: 10.1038/s41467-024-52308-3.

A FAPα-activated MRI nanoprobe for precise grading diagnosis of clinical liver fibrosis

Affiliations

A FAPα-activated MRI nanoprobe for precise grading diagnosis of clinical liver fibrosis

Jiahao Gao et al. Nat Commun. .

Abstract

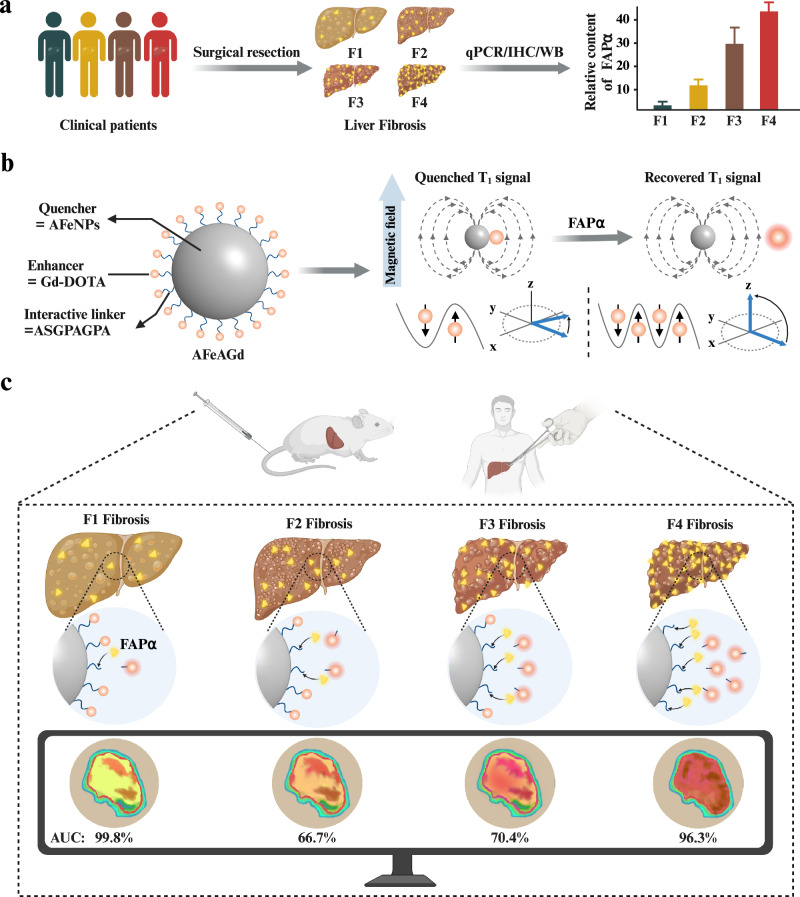
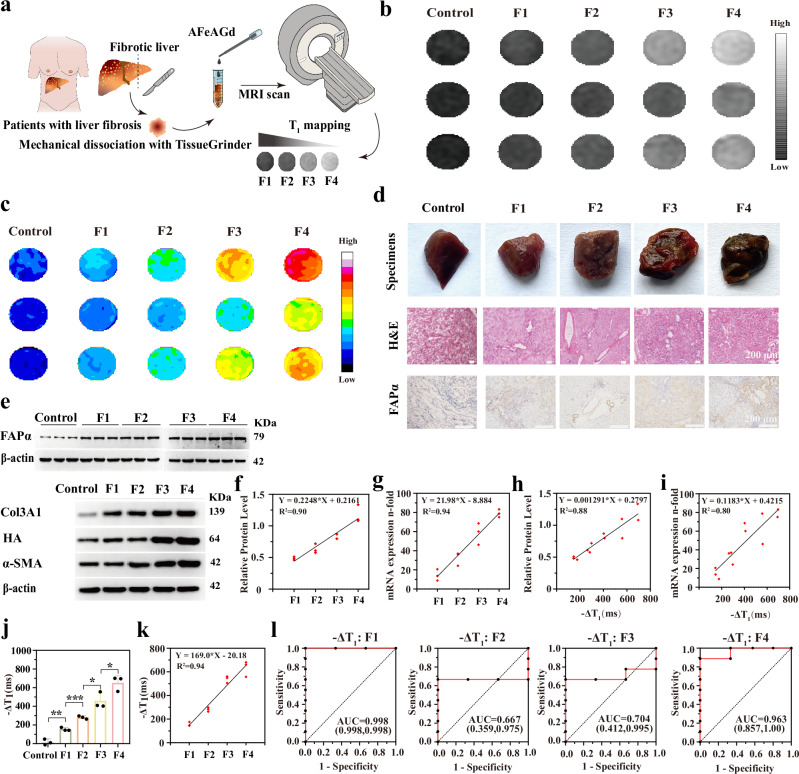
Molecular imaging holds the potential for noninvasive and accurate grading of liver fibrosis. It is limited by the lack of biomarkers that strongly correlate with liver fibrosis grade. Here, we discover the grading potential of fibroblast activation protein alpha (FAPα) for liver fibrosis through transcriptional analysis and biological assays on clinical liver samples. The protein and mRNA expression of FAPα are linearly correlated with fibrosis grade (R2 = 0.89 and 0.91, respectively). A FAPα-responsive MRI molecular nanoprobe is prepared for quantitatively grading liver fibrosis. The nanoprobe is composed of superparamagnetic amorphous iron nanoparticles (AFeNPs) and paramagnetic gadoteric acid (Gd-DOTA) connected by FAPα-responsive peptide chains (ASGPAGPA). As liver fibrosis worsens, the increased FAPα cut off more ASGPAGPA, restoring a higher T1-MRI signal of Gd-DOTA. Otherwise, the signal remains quenched due to the distance-dependent magnetic resonance tuning (MRET) effect between AFeNPs and Gd-DOTA. The nanoprobe identifies F1, F2, F3, and F4 fibrosis, with area under the curve of 99.8%, 66.7%, 70.4%, and 96.3% in patients' samples, respectively. This strategy exhibits potential in utilizing molecular imaging for the early detection and grading of liver fibrosis in the clinic.


Conflict of interest statement

The authors declare no competing interests.

Figures

Fig. 1
Fig. 1. A FAPα-activated MRI nanoprobe for precise grading diagnosis of clinical liver fibrosis.
a Screening and identification of FAPα as a pathological biomarker for liver fibrosis grading through abundant biological validation on liver fibrosis samples from clinical patients. b Schematic illustration of the construction of AFeAGd nanoprobe. Superparamagnetic quencher (AFeNPs) was connected to paramagnetic enhancer (Gd-DOTA) via a FAPα-responsive linker (ASGPAGPA). AFeAGd nanoprobe based on the MRET effect exhibited an “off/on” T1 MRI signal. c AFeAGd nanoprobe successfully achieved sensitive diagnosis of different fibrosis grades in mice models and clinical patients’ liver fibrosis samples. The area under the curve for identifying F1, F2, F3, and F4 fibrosis, were 99.8%, 66.7%, 70.4%, and 96.3% in patients’ liver samples, respectively. Figure 1 was created with BioRender.com released under a Creative Commons Attribution-NonCommercial-NoDerivs 4.0 International license.
Fig. 2
Fig. 2. Screening and identification of FAPα as a pathological marker for the grading diagnosis of liver fibrosis.
a Heat map of the distribution of FAPα and several common fibrosis markers in the mild and severe fibrosis cohorts of GSE-135251 dataset (Left), box plot of FAPα expression in the mild (n = 102) and severe (n = 68) fibrosis cohorts (Right) (Box plots are defined as minima, maxima, centre, bounds of box and 25– 75% percentile, p = 3.90 × 106). b Box plot of FAPα expression between each liver fibrosis grade in GSE-135251 dataset (F1: n = 48, F2: n = 54, F3: n = 54, F4: n = 14. Box plots are defined as minima, maxima, centre, bounds of box and 25–75% percentile. p = 2.70 × 105, p = 0.0200, p = 0.0213, from left to right, respectively). c Expression of FAPα in the control and fibrosis cohorts of the Huashan Hospital population (n = 6 biological replications. Box plots are defined as minima, maxima, centre, bounds of box and 25–75% percentile, p = 0.0081). d Western blot of several typical pathological markers of liver fibrosis (including α-SMA, collagen III, HA) and FAPα (n = 3 biological replications. The samples derive from the same experiment and that gels/blots were processed in parallel). e Quantitative histograms of WB bands (n = 3 biological replications, data are described as mean+ SD). f Scatter plots for linear correlation analysis between relative protein level and fibrosis grade (n = 3). g, qPCR expression histograms of several pathological markers of liver fibrosis in fibrotic and normal livers (n = 8 biological replications, data are described as mean+ SD, the exact p value in Fig. 2e, g are shown in the Source data file). h Scatter plots of linear correlation analysis between fibrosis grade and qPCR quantification of each biomarker (n = 8). i ROC curves of qPCR quantification of each diagnostic marker in two fibrosis diagnostic scenarios. Left, ROC curves for low-grade fibrotic liver versus high-grade fibrosis (F3, F4). Right, normal liver versus low-grade fibrosis (F1, F2) (n = 8). j Immunohistochemical staining of FAPα in fibrotic and normal liver (n = 8). k Scatter plots for linear correlation analysis between fibrosis grade and IHC quantification of FAPα (n = 8 biological replications, p = 9.02 × 104). (Comparisons of continuous variables between two groups were made using student’s t-test. Three and more groups comparisons were made using analysis of variance (ANOVA) with a Tukey’s post hoc test. Two-tailed tests are applicable to all statistical analyses. ns for not significant, * for p < 0.05, ** for p < 0.01, *** for p < 0.001).
Fig. 3
Fig. 3. Synthesis and characterization of the FAPα-responsive molecular MRI nanoprobe.
a The two units of the molecular MRET nanoprobe: an enhancer (Gd-DOTA) and a quencher (12 nm superparamagnetic nanoparticles). b, c TEM and HRTEM images of AFeNPs (each experiment was repeated 3 times independently with similarly results). d, e FFT images of local regions marked in (c). f XRD of AFeNPs and AFeAGd. g Zeta potential of AFeNPs, AFe-ASGPAGPA, and AFeAGd (data are presented as mean ± SD, n = 3, independent experiments). h FT-IR of AFeNPs, AFe-ASGPAGPA, and AFeAGd. i TGA curves of AFeNPs, AFe-ASGPAGPA, and AFeAGd. j Relative contents of Fe and Gd in AFeAGd (data are presented as mean ± SD, n = 3, independent experiments). k Field-dependent magnetization curves of AFeNPs, AFe-ASGPAGPA and AFeAGd. l COMSOL finite element simulation of the induced magnetic field distribution of AFeNPs and Gd-DOTA at different distances (d = 2, 7, 12 nm).
Fig. 4
Fig. 4. In vitro FAPα-responsive imaging performance of AFeAGd nanoprobes.
a Original T1WI images of Gd-DOTA, AFe, AFeAGd, and AFeAGd mixed with FAPα (0.015–0.05 mM of the above three probes is indicated as the Gd concentration, while the concentration label in AFe represents Fe concentration). b Corresponding pseudocolor map of Gd-DOTA, AFe, AFeAGd, and AFeAGd mixed with FAPα. c r1 from T1WI scans of Gd-DOTA, AFe, AFeAGd, and AFeAGd mixed with FAPα. d Histogram of r1 for AFe, AFeAGd, Gd-DOTA and AFeAGd+FAPα (1000 ng/mL). (n = 3 sample replications for each group, data are expressed as mean+SD. p = 7.25 × 107, p = 2.10 × 105, from left to right, respectively). e Original T1WI scan of AFeAGd after incubation with different concentrations of FAPα (1000, 500, 250, 125, 62.5 ng/mL). f Pseudocolor map of the concentration dependence of FAPα. g r1 for T1WI scans of AFeAGd after incubation with different concentrations of FAPα. h Scatter trends and histograms for r1, varying with FAPα concentration (n = 3 sample replications for each group, data are expressed as mean+SD). i Original T1WI scan of AFeAGd incubated with FAPα (1000 ng/mL) for different times (15, 30, 45, 60, 120 min). j Pseudocolor map of the incubation time dependence of FAPα. k r1 from T1WI scans of AFeAGd after incubation with FAPα for different times. l Scatter trends and histograms for r1, varying with incubation time (n = 3 sample replications for each group, data are expressed as mean+SD). m Original T1WI scan of AFeAGd after incubation with 500 ng/mL FAPα, MMPII, DPPIV, and the mixed enzyme. n Pseudocolor map of the enzyme response specificity of FAPα. o r1 from T1WI scans of AFeAGd after incubation with different enzymes. p Histogram of r1 for the enzyme response specificity of AFeAGd (n = 3 sample replications for each group, data are expressed as mean+SD. p = 2.70 × 105, p = 2.70 × 105, p = 2.90 × 105, from left to right, respectively). (Comparisons of continuous variables between two groups were made using student’s t-test. Three and more groups comparisons were made using ANOVA with a Tukey’s post hoc test. Two-tailed tests are applicable to all statistical analyses. ns for not significant, * for p < 0.05, ** for p < 0.01, *** for p < 0.001).
Fig. 5
Fig. 5. Quantitative liver fibrosis mapping of AFeAGd in the animal model.
a Representative images of T1WI-MRI acquired at two-time points (before and 1 h after injection) and corresponding H&E staining pictures in mice models (n = 3). b Representative images of T1 mapping and corresponding MASSON staining pictures in mice models (n = 3). c Histograms of ΔSNR in different grades of fibrotic mice (n = 3 biological replications, data are expressed as mean+SD. p = 0.0495, p = 0.5426, p = 0.0481, p = 0.1254, from left to right, respectively). d Linear correlation of ΔSNR with the quantitative WB expression (left) and qPCR quantification (right) of FAPα. e ROC curve for ΔSNR when identifying F1, F2, F3, and F4 liver fibrosis with other grades of fibrosis. f Histograms of ΔCNR in different grades of fibrotic mice (n = 3 biological replications, data are expressed as mean+SD. p = 0.0262, p = 0.0494, p = 0.0496, p = 0.0381, from left to right, respectively). g Linear correlation of ΔCNR with the quantitative WB expression (left) and qPCR quantification (right) of FAPα. h ROC curve for ΔCNR when identifying F1, F2, F3, and F4 liver fibrosis with other grades of fibrosis (n = 3). (Comparisons of continuous variables between two groups were made using student’s t-test. Three and more groups comparisons were made using ANOVA with a Tukey’s post hoc test. Two-tailed tests are applicable to all statistical analyses. ns for not significant, * for p < 0.05, ** for p < 0.01, *** for p < 0.001).
Fig. 6
Fig. 6. Quantitative liver fibrosis mapping of AFeAGd in the clinical samples.
a Schematic diagram of the quantitative liver fibrosis mapping of AFeAGd in the clinical sample. b Main T1WI MR images for liver fibrosis samples of different grades with added nanoprobes. c Pseudocolor map of clinical liver samples with nanoprobe injection. d Physical liver tissue, pathological staining and IHC expression of FAPα in different fibrosis samples used for the MRI study (each experiment was repeated 3 times independently with similarly results). e WB bands of FAPα and several other fibrosis grading markers (including α-SMA, collagen III, HA) in liver samples (each experiment was repeated 3 times independently with similarly results. The samples derive from the same experiment and that gels/blots were processed in parallel). f Linear correlation scatter plots between different liver fibrosis markers and liver fibrosis grade (for WB experiments) (n = 3). g Linear correlation scatter plots between different liver fibrosis markers and liver fibrosis grade (for qPCR) (n = 3). Scatter plots of the linear correlation between -ΔT1 value and FAPα expression at the protein level (h) and mRNA level (i) in clinical samples. j, k Histogram of -ΔT1 values and scatter plot of linear correlation between -ΔT1 value and fibrosis grades (n = 3 biological replications, data are expressed as mean+SD. p = 0.0054, p = 0.0009, p = 0.0285, p = 0.0497, from left to right, respectively). l ROC curve of -ΔT1 values in clinical samples for distinguishing F1, F2, F3, and F4 liver fibrosis from each other grade of fibrosis. (Comparisons of continuous variables between two groups were made using student’s t-test. Three and more groups comparisons were made using ANOVA with a Tukey’s post hoc test. Two-tailed tests are applicable to all statistical analyses. ns for not significant, * for p < 0.05, ** for p < 0.01, *** for p < 0.001).

References

    1. Hernandez-Gea, V. & Friedman, S. L. Pathogenesis of liver fibrosis. Annu. Rev. Pathol.6, 425–456 (2011). 10.1146/annurev-pathol-011110-130246 - DOI - PubMed
    1. Kisseleva, T. & Brenner, D. Molecular and cellular mechanisms of liver fibrosis and its regression. Nat. Rev. Gastroenterol. Hepatol.18, 151–166 (2021). 10.1038/s41575-020-00372-7 - DOI - PubMed
    1. Taylor, R. S. et al. Association Between Fibrosis Stage and Outcomes of Patients With Nonalcoholic Fatty Liver Disease: A Systematic Review and Meta-Analysis. Gastroenterology158, 1611–1625.e1612 (2020). 10.1053/j.gastro.2020.01.043 - DOI - PubMed
    1. Boursier, J. et al. Practical diagnosis of cirrhosis in non-alcoholic fatty liver disease using currently available non-invasive fibrosis tests. Nat. Commun.14, 5219 (2023). 10.1038/s41467-023-40328-4 - DOI - PMC - PubMed
    1. Goodman, Z. D. Grading and staging systems for inflammation and fibrosis in chronic liver diseases. J. Hepatol.47, 598–607 (2007). 10.1016/j.jhep.2007.07.006 - DOI - PubMed

Publication types

Substances