. 2024 Sep 13;14(1):21387.
doi: 10.1038/s41598-024-71984-1.

Effectiveness of non-pharmaceutical interventions for COVID-19 in USA

Affiliations

Effectiveness of non-pharmaceutical interventions for COVID-19 in USA

Yuhang Liu et al. Sci Rep. .

Abstract

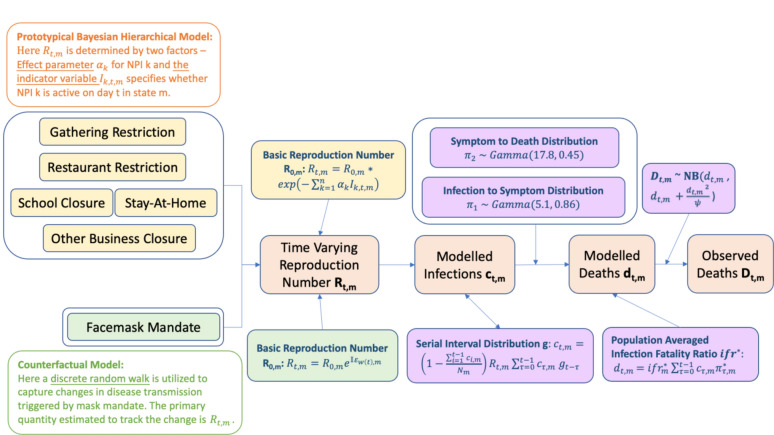
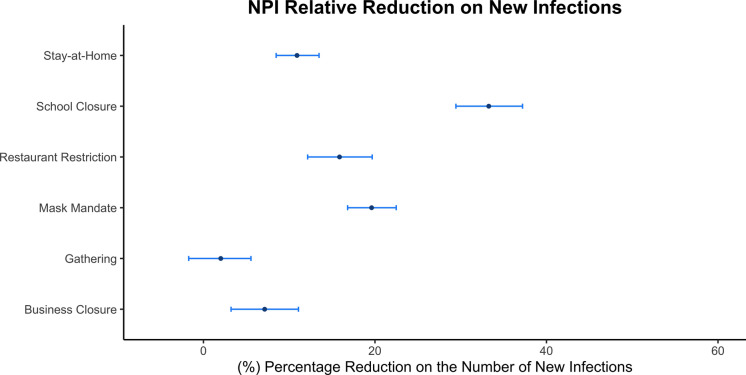
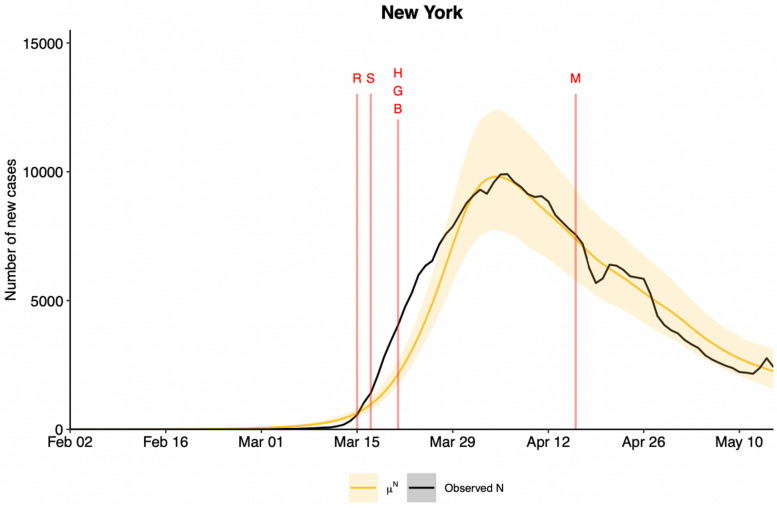
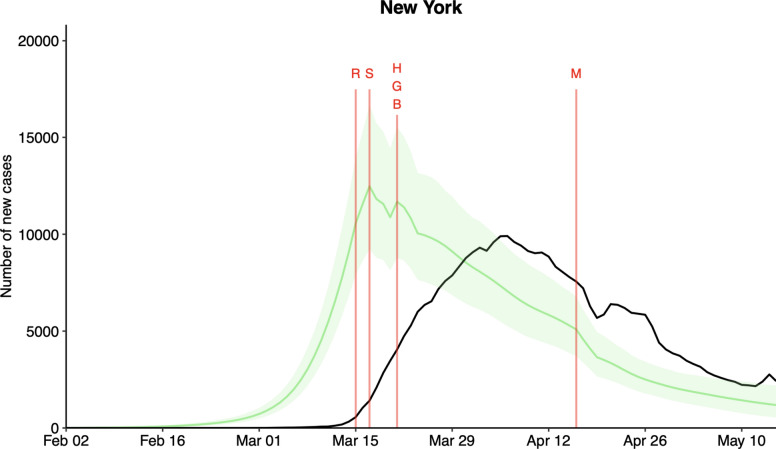
Worldwide, governments imposed non-pharmaceutical interventions (NPIs) during the COVID-19 pandemic to contain the pandemic more effectively. We examined the effectiveness of individual NPIs in the United States during the first wave of the pandemic. Three types of analyses were performed. First, a prototypical Bayesian hierarchical model was employed to gauge the effectiveness of five NPIs and they are gathering restriction, restaurant capacity restriction, business closure, school closure, and stay-at-home order in the 42 states with over 100 deaths by the end of the wave. Second, we examined the effectiveness of the face mask mandate, the sixth and most controversial NPI by counterfactual modeling, which is a variant of the prototypical Bayesian hierarchical model allowing us to answer the question of what if the state had imposed the mandate or not. The third analysis used an advanced Bayesian hierarchical model to evaluate the effectiveness of all six NPIs in all 50 states and the District of Columbia, and thereby provide a full-scale estimation of the effectiveness of NPIs and the relative effectiveness of each NPI in the entire United States. Our results have enhanced the collective knowledge on the general effectiveness of NPIs in arresting the spread of COVID-19.


Conflict of interest statement

The authors declare no competing interests.

Figures

Fig. 1
Fig. 1
Flow chart of the first two sets of analyses: (1) Analysis 1 uses the prototypical Bayesian hierarchical model. In the first analysis, a piecewise constant function is used to scale Rt,m from the baseline reproduction number R0,m and the NPI in different states and times. The model sets an indicator variable Ik,t,m which equals to 1 for the kth intervention group in state m at time t, and 0 otherwise. The functional form of Rt,m is given by Rt,m=R0,mexp-k=1nαkIk,t,m and the intervention-specific effects αk are shared among all states; (2) Analysis 2 uses the Counterfactual model, where the functional form for the time-varying reproduction number is given by Rt,m=eα0,m+Iεwt,m=R0,meIεwt,m as described in the text. Once reached the specific date set by the researcher, the reproduction number of the recipient group will be replaced by the reproduction number of the donor group such that the contact pattern change on disease transmission can be transposed rendering the model counterfactual.
Fig. 2
Fig. 2
Analysis 3 uses the Advanced Bayesian Hierarchical Model Framework, where it is assumed that (i) the daily number of true new infections is related to the daily number of contagious subjects and the presence of non-pharmaceutical interventions, (2) the observed daily number of new infections is to the daily number of true new infections; and (3) the daily number of contagious subjects is related to the daily number of true new infections.
Fig. 3
Fig. 3
Mean relative percentage reduction in Rt and its 95% credible interval for each of the NPIs from Analysis 1. Smaller relative percentage reduction in Rt suggests less effectiveness of the NPI while larger relative percentage reduction indicates that the NPI contributes more to reducing the COVID-19 transmission. Figure shows School Closure is the most effective NPI while the Stay-at-Home order is the second and the other three NPIs are deemed to be ineffective all at the 95% confidence level.
Fig. 4
Fig. 4
Rt estimates for New York State over the study period using analysis 1 with the 95% and 50% credible intervals in light blue and dark blue, respectively. The start date of gathering size limit, other business closure, restaurant restriction, school closure, and stay at home orders are marked in pink, purple, yellow, green, and orange, respectively.
Fig. 5
Fig. 5
Estimated median time varying reproduction numbers from analysis 2 using the Counterfactual Modeling approach. The left figure shows the counterfactual Rt profiles for non-mask mandate states adopting the mask mandate policy in green and the original fitted Rt profiles in red. The right figure shows the counterfactual Rt profiles for mask mandate states if they had removed the mask mandate policy in red and the original fitted Rt profiles in green.
Fig. 6
Fig. 6
Relative Reductions in percentage of each NPI in new infections using Analysis 3. For each NPI, the posterior mean percentage reduction in the number of new infections is shown in solid dark dots and its 95% credible interval are shown in blue error bars. Smaller relative percentage reduction in the number of new infections suggests less effectiveness of the NPI and larger relative percentage reduction indicates the NPI contributes more to curbing the transmission of COVID-19.
Fig. 7
Fig. 7
Expected reported daily number of new infections (the posterior mean) in yellow and 95% credible bands shaded in light yellow from Analysis 3 and the daily number of new infections reported by the Johns Hopkins University Dashboard in black for the State of New York over the study period. The vertical line in red indicates the first day that each NPI was implemented in New York (S: School closure; R: Restaurant Restriction; G: Restriction on Gathering Size; B: Other Business Closure; H: Stay-at-Home Order; M: Face mask Mandate).
Fig. 8
Fig. 8
Expected Daily Number of True New Infections (the posterior mean) in green and 95% credible interval shaded in light green using Analysis 3 and the daily number of new infections reported by the Johns Hopkins University Dashboard in black for the State of New York over the study period. The vertical line in red indicates the first day that the NPI was implemented in New York (S: School closure; R: Restaurant Restriction; G: Restriction on Gathering Size; B: Other Business Closure; H: Stay-at-Home Order; M: Face mask Mandate).

References

    1. Gorbalenya, A. E. et al. The species Severe acute respiratory syndrome-related coronavirus: Classifying 2019-nCoV and naming it SARS-CoV-2. Nat. Microbiol.5, 536–544 (2020). 10.1038/s41564-020-0695-z - DOI - PMC - PubMed
    1. News, A. B. C. Coronavirus declared global health emergency by WHO after 1st person-to-person US case reported. ABC News https://abcnews.go.com/Health/world-health-organization-decide-coronavir....
    1. WHO declares coronavirus a pandemic, urges aggressive action. AP NEWS https://apnews.com/article/united-nations-michael-pence-religion-travel-... (2021).
    1. Sun, J. et al. COVID-19: Epidemiology, evolution, and cross-disciplinary perspectives. Trends Mol. Med.26, 483–495 (2020). 10.1016/j.molmed.2020.02.008 - DOI - PMC - PubMed
    1. A Timeline of COVID-19 Developments in 2020. https://www.ajmc.com/view/a-timeline-of-covid19-developments-in-2020.