. 2024 Sep;21(9):1693-1701.
doi: 10.1038/s41592-024-02384-6. Epub 2024 Sep 13.

Serialized on-grid lift-in sectioning for tomography (SOLIST) enables a biopsy at the nanoscale

Affiliations

Serialized on-grid lift-in sectioning for tomography (SOLIST) enables a biopsy at the nanoscale

Ho Thuy Dung Nguyen et al. Nat Methods. 2024 Sep.

Abstract

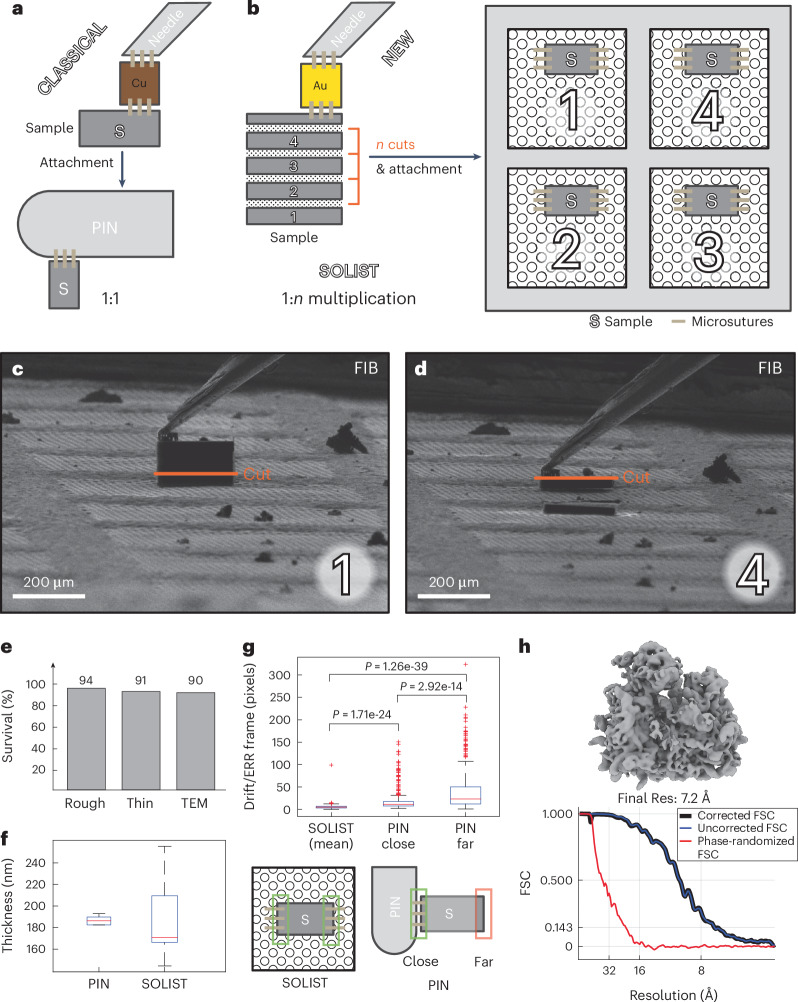
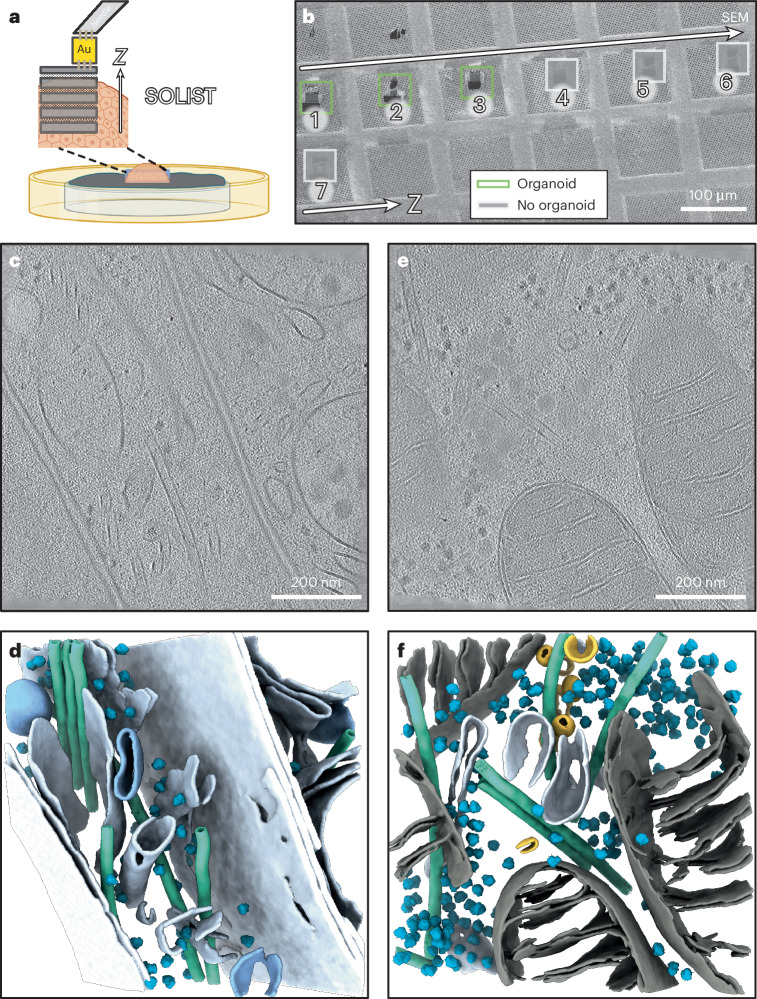
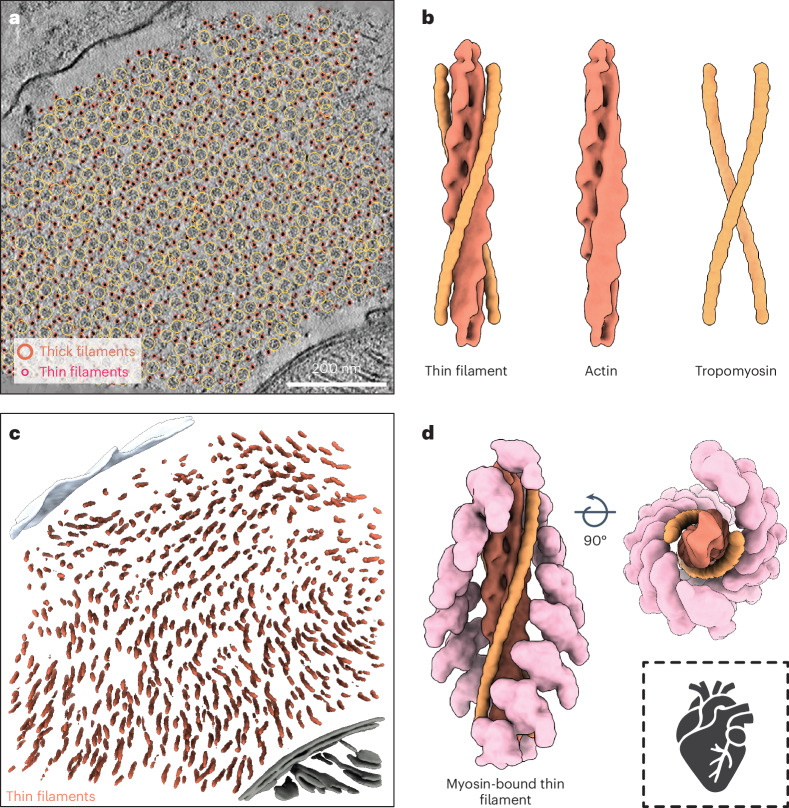
Cryo-focused ion beam milling has substantially advanced our understanding of molecular processes by opening windows into cells. However, applying this technique to complex samples, such as tissues, has presented considerable technical challenges. Here we introduce an innovative adaptation of the cryo-lift-out technique, serialized on-grid lift-in sectioning for tomography (SOLIST), addressing these limitations. SOLIST enhances throughput, minimizes ice contamination and improves sample stability for cryo-electron tomography. It thereby facilitates the high-resolution imaging of a wide range of specimens. We illustrate these advantages on reconstituted liquid-liquid phase-separated droplets, brain organoids and native tissues from the mouse brain, liver and heart. With SOLIST, cellular processes can now be investigated at molecular resolution directly in native tissue. Furthermore, our method has a throughput high enough to render cryo-lift-out a competitive tool for structural biology. This opens new avenues for unprecedented insights into cellular function and structure in health and disease, a 'biopsy at the nanoscale'.


Conflict of interest statement

The authors declare no competing interests.

Figures

Fig. 1
Fig. 1. Concept and key features of SOLIST.
a, Schematic representation of the classical lift-out procedure using pin grids. b, By dividing the sample chunk into multiple sections, SOLIST effectively multiplies the number of lamellas obtained. c,d, FIB view images of the first (c) and the last (d) slice of a four-lamella SOLIST session being attached to the grid (see also Supplementary Video 1). e, Success rates of each step of the SOLIST procedure: section attachment (Rough), fine milling (Thin) and transfer to the transmission electron microscope (TEM; n = 46 lamellas). f, Box plot of lamella thickness of the classical lift-out (PIN) and the yeast test data set (SOLIST). Mean ± s.d.: PIN, 184 ± 9.3 nm; SOLIST, 187 ± 31 nm (PIN, n = 6; SOLIST, n = 32). g, Comparison of beam-induced motion in SOLIST and classical lift-out lamellas attached to pin grids (n = 9 tomograms per group; each 41 tilts; P of two-sided t-test indicated in plot). h, The resolution potential of SOLIST exemplified by a S. cerevisiae ribosome average at 7.2 Å obtained from 65 tomograms (gold-standard Fourier shell correlation (FSC) at 0.143). For the box plots: the whiskers indicate maximum and minimum values not considered outliers, the top of the box represents the 75th percentile and the bottom of the box the 25th percentile; the red line indicates the median, and the red plus markers (if plotted) indicate individual outliers. Source data
Fig. 2
Fig. 2. SOLIST enables 3D-correlative targeting in HPF samples.
a, Coarse SOLIST lamellas are screened for the target of interest at the cryo-fluorescence microscope, and 3DC is performed using the fiducial beads. b,c, The shallow milling angle (b) makes only an array of ca. 4 × 12 squares on the grid (c) accessible for attachment and correlation. d, 3D CLEM on a coarse SOLIST lamella using the registration of the fiducial beads to overlay fluorescence light microscopy (FLM) and FIB views. The coarse sample chunk (S and dashed outline) contains the GFP signal as seen from the projection (the crosshair shows the center of the original image). e, TEM montage of the targeted SOLIST lamella produced in d, overlaid with the fluorescence data. f, Higher-magnification TEM montage partially overlaid with the fluorescence data showing that the target is contained within the lamella. Parts of the image were created with BioRender.com.
Fig. 3
Fig. 3. SOLIST enables investigations in developing human forebrain organoids.
a, A chunk of high-pressure-frozen organoid slice is translated into a series of SOLIST slices. The sequential sectioning compensates for the lack of accuracy in z-targeting. b, Within the series of lamellas, organoid material is found in the deeper layers and, therefore, in the earlier attached sections. cf, Representative tomograms (c,e) and corresponding segmentations (d,f) from adjacent SOLIST sections show cellular structures in brain organoid: membranes (gray), vesicles (yellow and blue), mitochondria (black), ribosome (cyan) and microtubules (turquoise); see also Supplementary Video 3. Parts of the image were created with BioRender.com.
Fig. 4
Fig. 4. SOLIST visualizes native mouse tissue organization.
a, Tomograms of mouse brain reveal membranes (gray), axonal microtubules (turquoise) and vesicles (yellow and blue). b, The sampled liver tissue contained highly complex membranes associated with abundant ribosomes (cyan). c, From only 15,000 particles, a subnanometer ribosome subtomogram average was reconstructed, revealing several well-resolved helices at 8.3 Å (gold-standard Fourier shell correlation (FSC) at 0.143).
Fig. 5
Fig. 5. SOLIST resolves native mouse cardiac filaments at molecular resolution.
a, A cross-section tomogram of a muscle cell from the left heart ventricle. Thick (large circles) and thin filaments (small circles) are clearly visible. b, Subtomogram averages of the thin filaments at 18 Å from only three cross-section tomograms reveal the actin (red) and tropomyosin components (orange). c, Their highly ordered arrangement becomes apparent after averaging and pasting back the thin fibers. d, In addition to the bare thin filament, a myosin-bound actin (salmon) class is found. It represents an average of all potential motor binding sites rather than an actual state (composite maps shown).
Extended Data Fig. 1
Extended Data Fig. 1. SOLIST yields high resolution subtomogram averages in yeast.
a, Consensus cryo-EM map of S. cerevisiae ribosomes acquired and reconstructed from HPF-frozen SOLIST lamellas. b, Fourier shell correlation (FSC) of the map in a. c, Secondary structure details including iconic helical RNAs are clearly visible at the resolution of 7.2 Å. d, Data acquisition and map refinement parameters. Resolution of 10k randomly selected subtomogram averages (10 k rand. particles): 7.5 Å; Final resolution (Final Res.) of the full dataset of 17k particles: 7.2 Å (LO = Lift-Out; C3D = Relion Class3D). e, The local resolution extends to Nyquist (resampled pixel size of 2.5 Å/pix) and shows a higher map quality toward the core of the ribosomal subunits.
Extended Data Fig. 2
Extended Data Fig. 2. Representative tomograms of native mouse brain tissue.
Slices through reconstructed tomograms (a, c) and corresponding segmentations (b, d) reveal networks of membranes (gray), distinct types of vesicles (yellow and blue), and microtubules (turquoise).
Extended Data Fig. 3
Extended Data Fig. 3. Representative tomograms of native mouse liver tissue.
Slices through reconstructed tomograms (a, c) and corresponding segmentations (b, d) show crowded cellular environments such as networks of membrane (gray), distinct types of vesicles (blue), glycogen-storage granules (yellow), and ribosome (cyan).
Extended Data Fig. 4
Extended Data Fig. 4. Ribosome average from native mouse liver tissue.
a, Final consensus map of the reconstructed ribosome average. b, Fourier shell correlation (FSC) curve for the final reconstructed half maps and gold-standard resolution. c, Data acquisition and map refinement parameters. Final resolution (Final Res.): 8.3 Å. (LO = Lift-Out; C3D = Relion Class3D).
Extended Data Fig. 5
Extended Data Fig. 5. TEM overviews of native mouse heart tissue.
a-d, Lamella montage overviews. e-h, Corresponding zoomed-in views of a-d highlighting diverse tissue structures. i,j, Representative slices through tomograms of muscles showing thick and thin filaments in cross-sections.
Extended Data Fig. 6
Extended Data Fig. 6. Pipeline and averages of cardiac thin filaments in native mouse heart tissue.
a, Overview of the workflow used to resolve the native mouse filaments. b, Consensus refinements of the ‘actin-like’ and ‘myo-like’ classes filtered to their final resolution. c-d, Fourier shell correlation (FSC) curves for the refined maps in b. e, Refined helical parameters (obtained from relion_helical_toolbox) used in the final reconstructions. f, Data acquisition and map refinement parameters (for the combined classes). Final resolution (Final Res.): 18 Å. (LO = Lift-Out; C3D = Relion Class3D).

References

    1. Lucas, B. A. & Grigorieff, N. Quantification of gallium cryo-FIB milling damage in biological lamellae. Proc. Natl Acad. Sci. USA120, e2301852120 (2023). 10.1073/pnas.2301852120 - DOI - PMC - PubMed
    1. Berger, C. et al. Cryo-electron tomography on focused ion beam lamellae transforms structural cell biology. Nat. Methods20, 499–511 (2023). 10.1038/s41592-023-01783-5 - DOI - PubMed
    1. Wang, Z. et al. Structures from intact myofibrils reveal mechanism of thin filament regulation through nebulin. Science375, eabn1934 (2022). 10.1126/science.abn1934 - DOI - PubMed
    1. Wolff, G. et al. A molecular pore spans the double membrane of the coronavirus replication organelle. Science369, 1395–1398 (2020). 10.1126/science.abd3629 - DOI - PMC - PubMed
    1. Dahl, R. & Staehelin, L. A. High pressure freezing for the preservation of biological structure: theory and practice. J. Electron Microsc. Tech.13, 165–174 (1989). 10.1002/jemt.1060130305 - DOI - PubMed

LinkOut - more resources