. 2024 Sep;3(9):1067-1082.
doi: 10.1038/s44161-024-00532-x. Epub 2024 Aug 23.

Tissue-resident memory T cells in epicardial adipose tissue comprise transcriptionally distinct subsets that are modulated in atrial fibrillation

Affiliations

Tissue-resident memory T cells in epicardial adipose tissue comprise transcriptionally distinct subsets that are modulated in atrial fibrillation

Vishal Vyas et al. Nat Cardiovasc Res. 2024 Sep.

Abstract

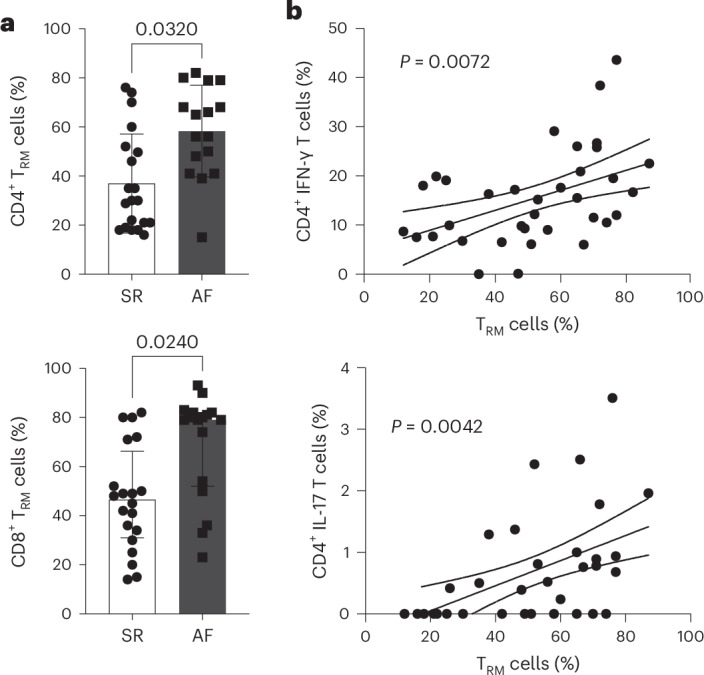
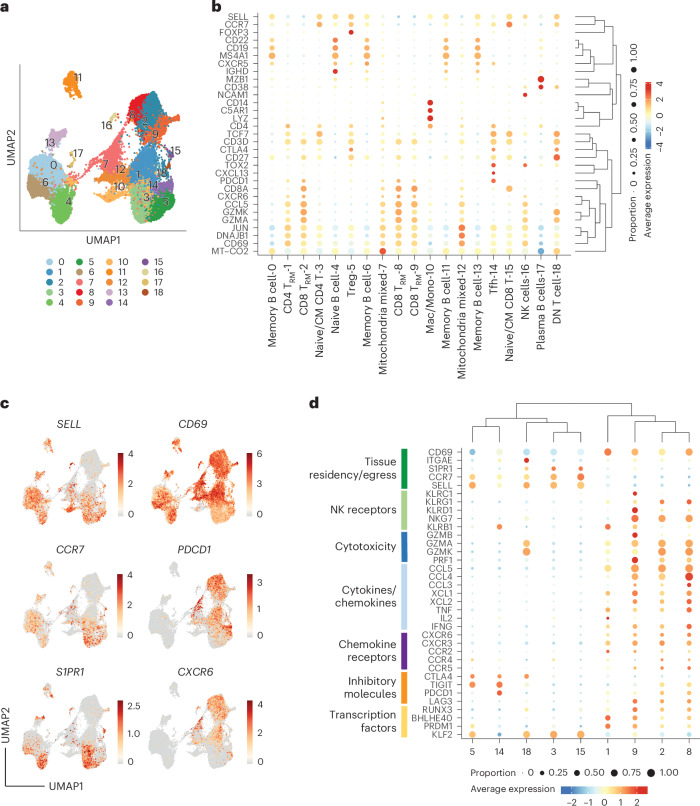
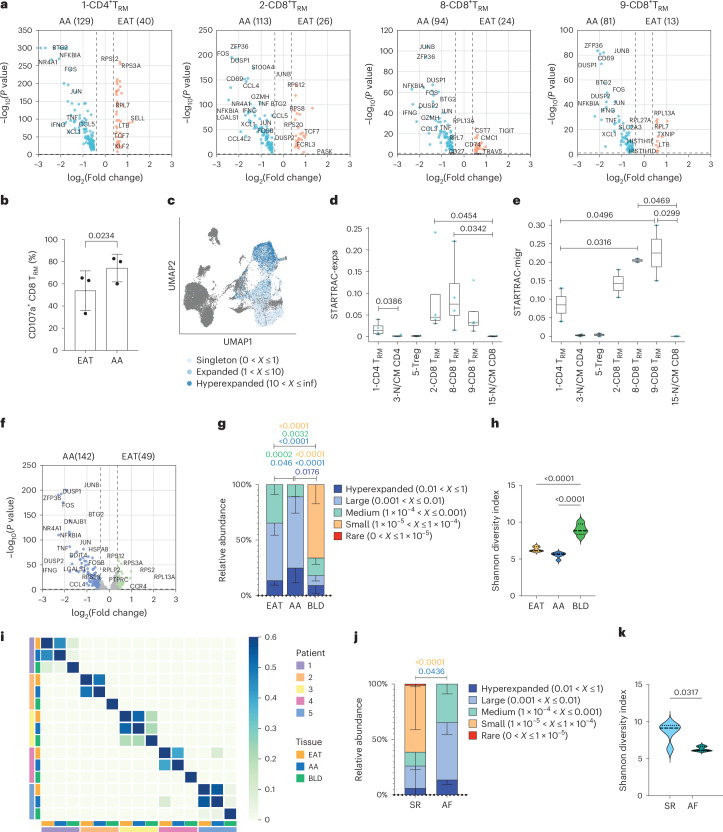
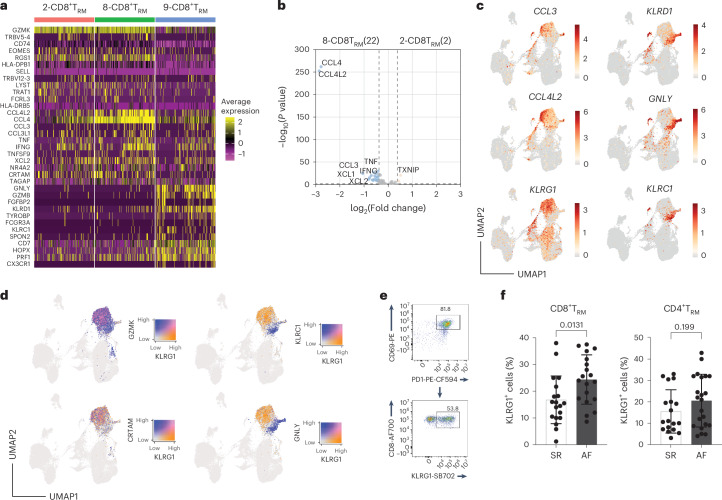
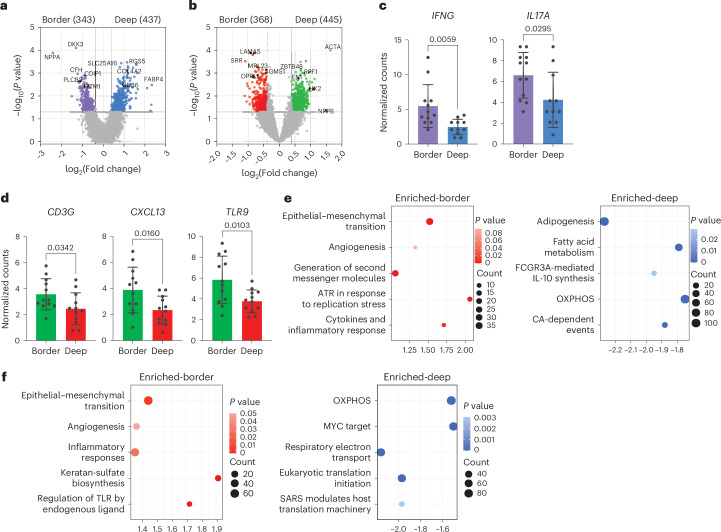
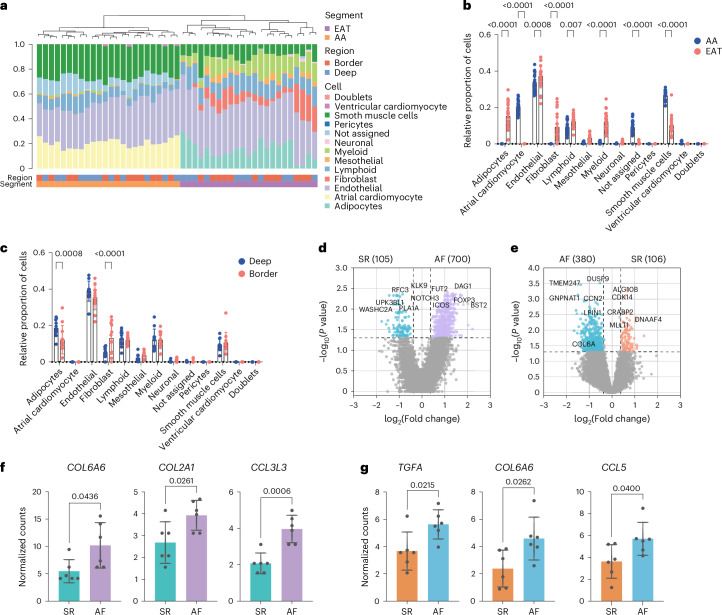
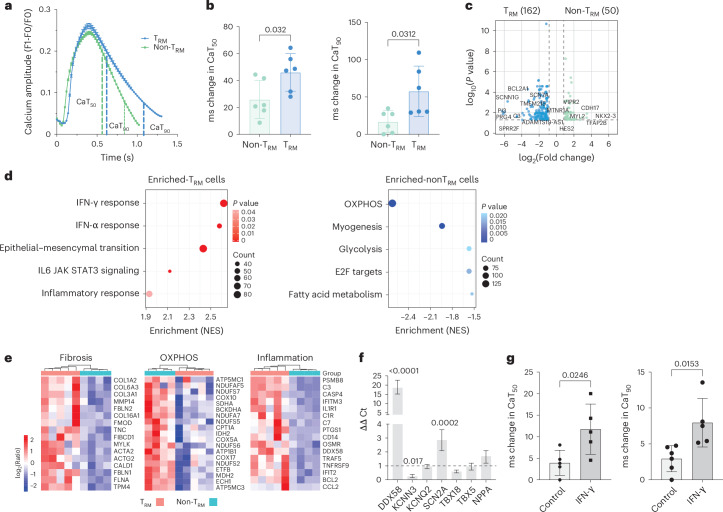
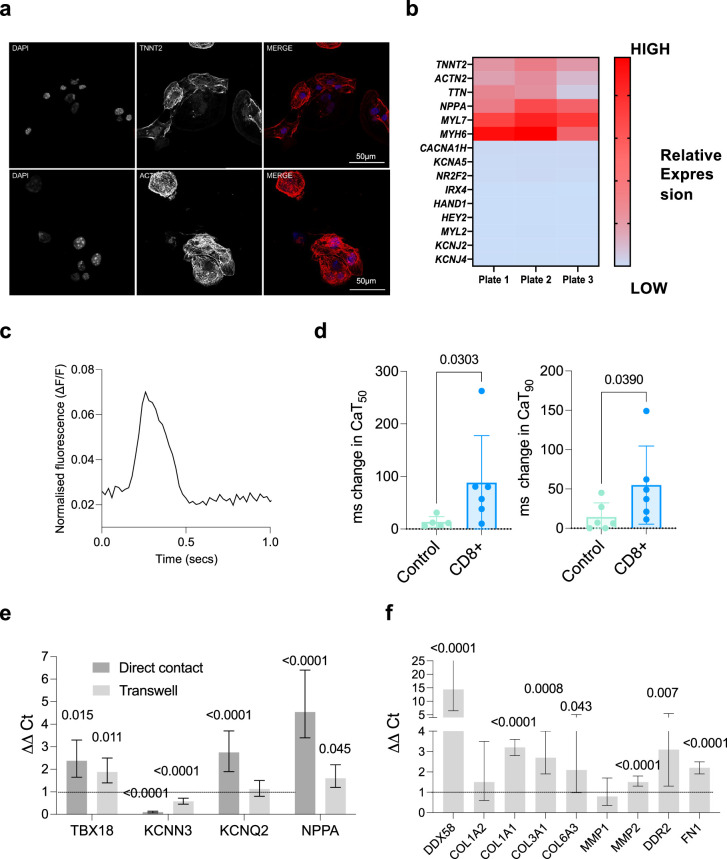
Atrial fibrillation (AF) is the most common sustained arrhythmia and carries an increased risk of stroke and heart failure. Here we investigated how the immune infiltrate of human epicardial adipose tissue (EAT), which directly overlies the myocardium, contributes to AF. Flow cytometry analysis revealed an enrichment of tissue-resident memory T (TRM) cells in patients with AF. Cellular indexing of transcriptomes and epitopes by sequencing (CITE-seq) and single-cell T cell receptor (TCR) sequencing identified two transcriptionally distinct CD8+ TRM cells that are modulated in AF. Spatial transcriptomic analysis of EAT and atrial tissue identified the border region between the tissues to be a region of intense inflammatory and fibrotic activity, and the addition of TRM populations to atrial cardiomyocytes demonstrated their ability to differentially alter calcium flux as well as activate inflammatory and apoptotic signaling pathways. This study identified EAT as a reservoir of TRM cells that can directly modulate vulnerability to cardiac arrhythmia.


Conflict of interest statement

The authors declare no competing interests.

Figures

Fig. 1
Fig. 1. Evaluation of TRM cell frequency in EAT.
EAT immune infiltrate from patients with AF or patients in SR was characterized by flow cytometry. a, Bar graphs indicate the frequency of CD4+ and CD8+ TRM cells over total CD4+ or CD8+CD45RO+ T cells, respectively, in the EAT (n = 26 SR and n = 18 AF biological replicates). Statistical significance was determined using unpaired two-tailed t-test for the parametrically distributed groups. Data are represented as mean ± s.d. b, Cytokine production was evaluated by intracellular staining by flow cytometry. Correlation analysis of IFN-γ and IL-17 production with the frequency of CD4+ TRM cells measured by linear regression. Graphs show 95% confidence bands (r = 0.299) and two-tailed P value analysis. All data show individual patients (n = 44).
Fig. 2
Fig. 2. CITE-seq analysis of immune cells in the EAT and AA.
a, UMAP plots of merged EAT and AA samples identified 19 cell clusters. b, Bubble plot shows expression levels of representative markers within each cluster. c, Canonical markers used to identify TRM cells are represented in the UMAP plot. Data are colored according to average expression levels. Expression values are normalized for quantitative comparison within each dataset. d, Bubble plot showing the expression distribution of effector molecules, receptors and transcription factors among T cell populations. DN, double-negative.
Fig. 3
Fig. 3. Characterization of TRM cells across EAT and AA tissues.
a, Volcano plots showing the average log fold changes and average Benjamini–Hochberg-corrected P values for pairwise differential expression between EAT and AA tissues for all TRM cluster populations based on the non-parametric Wilcoxon rank-sum test. b, Expression of surface CD107a was analyzed on activated CD8+ TRM cells by flow cytometry. Bar graph indicates the percentage of CD107a+CD8+ TRM cells in paired EAT and AA samples. Data are presented as mean ± s.d. Statistical significance was determined using paired two-tailed t-test (n = 3 biological replicates). c, UMAP visualization of clonotype expansion levels among clusters. Data are colored according to clonal expansion levels. d, Clonal expansion levels of T cell clusters quantified by STARTRAC-expa indices for each sample. Statistical significance was determined using the Kruskal–Wallis test with Dunn’s multiple comparisons test (n = 4 biological replicates) e, Migration potential of T cell clusters quantified by STARTRAC-migr indices for each patient. Statistical significance was determined using one-way ANOVA with Tukey’s multiple comparisons test (n = 2 biological replicates). Box plots in d and e show data points from individual tissues with means and minimum/maximum values. f, Volcano plots showing the average log fold changes and average Benjamini–Hochberg-corrected P values for pairwise differential expression between hyperexpanded TCR clones in the EAT and AA tissues. g, Bar graph indicates the relative abundance of TCRα clonotypes in paired tissues EAT, AA and blood (BLD) (n = 5 biological replicates). The relative abundance of TCRα clonotypes was calculated using the Immunarch package in R (version 1.0.0) and grouped accordingly as rare, small, medium, large and hyperexpanded. Data are presented as mean ± s.d. Statistical significance was evaluated using two-way ANOVA with Sidak’s multiple comparisons test. h, TCRα diversity between paired tissues (n = 5 biological replicates). Statistical significance was evaluated with one-way ANOVA followed by the Tukey’s multiple comparison test. i, Heatmap illustrating the compositional TCRα similarity between paired samples assessed using the Morisita–Horn index. j, Bar graph indicates the relative abundance of TCRα clonotypes between patients with AF and patients in SR (n = 5 biological replicates). Data are presented as mean values ± s.d. Statistical significance was evaluated using two-way ANOVA with Sidak’s multiple comparisons test. k, TCRα diversity between patients with AF and patients in SR (n = 5 biological replicates). Statistical significance was evaluated using the two-tailed Mann–Whitney U-test for non-parametric data and represented as mean ± s.d. Panels hk show medians, and light dotted lines show 1st and 3rd quartiles. inf, infinity. Source data
Fig. 4
Fig. 4. CITE-seq identifies two CD8+ TRM cell populations with a distinct core set of genes.
a, Heatmap shows average gene expression by curated CD8+ TRM cell populations that had a fold change greater than 2 and P < 0.05 by the binomial test for at least one of the clusters. b, Volcano plots showing the average log fold changes and average Benjamini–Hochberg-corrected P values for pairwise differential expression between CD8+ TRM cell clusters 8 and 2 based on the non-parametric Wilcoxon rank-sum test. c, UMAP of representative selected genes differentially expressed between two main CD8+ TRM cell clusters. Color bars indicate average expression. Expression values are normalized for quantitative comparison within each dataset. d, UMAP showing co-expression of selective genes differentially expressed between two main CD8+ TRM cell clusters. Color bars indicate level of overlap expression. e, Representative dot plot showing KLRG1 expression. f, Bar graphs indicate the frequency of KLRG1+CD4+ and CD8+ TRM cells in the EAT. Each point represents an individual patient (n = 22 SR and n = 18 AF). Statistical significance was determined using two-tailed unpaired t-test for the parametrically distributed groups. Data are represented as mean and s.d.
Fig. 5
Fig. 5. Regional differences identified by spatial transcriptomics.
a, Volcano plot showing the average log fold changes in gene expression between border zone regions and deep in the tissue in the EAT. b, Volcano plot showing the average log fold changes in gene expression between border zone regions and deep in the tissue in the AA. a,b, Differential expression was performed using the linear mixed-effect model showing the average log fold changes and P values. c,d, Bar graph showing normalized counts of selective genes in the EAT (c) and AA (d), respectively. Statistical significance was determined using two-tailed paired t-test for parametric data, represented as mean and s.d. For normalized counts, Q3 normalization uses the top 25% of expressers to normalize across ROIs/segments e, GSEA pathway enrichment analysis of upregulated and downregulated DEGs in the EAT border zone compared to deep in the tissue. f, As in e but upregulated and dowregulated DEGs in the AA border zone compared to deep in the tissue. Pathway statistical significance was assessed using one-sided Fisher’s exact test. ae, Assays were performed in three biological replicates in technical triplicates.
Fig. 6
Fig. 6. Tissue remodeling in the border zone.
a, Proportion of cell types in the EAT and AA identified by cellular deconvolution. Each bar represents an individual ROI. b, Bar graph comparing the proportion of cell types over total cells between the EAT and AA. c, Bar graph comparing the proportion of cell types over total cells between the EAT border zone and deep in the tissue. b,c, Statistical significance was evaluated by two-way ANOVA with Sidak’s multiple comparison test. Bars represent mean ± s.d. d, Volcano plots showing the average log fold changes in gene expression in the EAT border zone between patients with AF and patients in SR. e, As in d but showing expression differences in the AA border zone between patients with AF and patients in SR. d,e, Differential expression was performed using the linear mixed-effect model showing the average log fold changes and P values. f, Bar graph showing normalized counts of selective genes in the EAT border zone between patients with AF and patients in SR. g, As in f but in the AA border zone between patients with AF and patients in SR. f,g, Statistical significance was determined using two-tailed paired t-test for parametric data, represented as mean and s.d. For normalized counts, Q3 normalization uses the top 25% of expressers to normalize across ROIs/segments. ag, Assays were performed in three biological replicates in technical triplicates.
Fig. 7
Fig. 7. Calcium dynamics in iPSC atrial cardiomyocytes.
a, Graph demonstrating a typical calcium transient after addition of T cells with the key parameters CaT50 and CaT90 depicted (n = 6 biological replicates). Each point represents mean ± s.e.m. b, Bar graphs demonstrating percentage change in CaT50 and CaT90 in CD4+ TRM and non-TRM cells (n = 6 biological replicates). Statistical significance was assessed using two-tailed t-test for parametric data, represented as mean and s.d. c, Volcano plot demonstrating differential gene expression between the TRM and non-TRM samples. Significance threshold of P < 0.05 log10 adjusted and log2 fold change > 1. d, GSEA pathway enrichment analysis of upregulated and downregulated DEGs in the iPSC-CMs cultured with CD4+ TRM cells compared to non-TRM cell cultures. Pathway statistical significance was assessed using one-sided Fisher’s exact test. e, Heatmap showing expression of genes associated with fibrosis, OXPHOS and inflammation. c,e, The Wald test from the DESeq2 package was used to test significance using false discovery rate-adjusted P values. f, iPSC-CMs were cultured with recombinant 50 ng ml−1 IFN-γ for 8 h. Relative expression levels of selective genes in iPSC-CMs (n = 6 technical replicates from three independent experiments) were analysed by RT–PCR. Expression levels were normalized to GAPDH expression. Bars represent expression in treated cells compared to untreated, which was set at 1 and indicated with dotted lines. Bars represent the mean ratio and upper and lower limits. Statistical significance was determined using unpaired two-tailed t-test. g, Bar graphs demonstrating percentage change in CaT50 and CaT90 in iPSC-CMs treated with IFN-γ (n = 5 technical replicates). Statistical significance was determined using unpaired two-tailed t-test for parametric data, represented as mean and s.d. NES, normalized enrichment score. Source data
Extended Data Fig. 1
Extended Data Fig. 1. Immune profiling of EAT.
a. Gating strategy for the identification of lymphoid and myeloid cells in tissue. b-d. Absolute number of immune cells in patients with AF and on SR across EAT (b), SAT (c) and blood (d). e. Percentages of myeloid and lymphoid cells in the EAT. Statistical significance was determined by the unpaired two-tailed Mann-Whitney test, and data are represented as Mean ± SD. b-e. Data shows individual patients (n=26 SN and 18 AF biological replicates).
Extended Data Fig. 2.
Extended Data Fig. 2.. Frequency of TRM cells in AF.
a. Gating strategy for the identification of TRM cells. Immune cells were gated on live CD3+CD4+ or CD8+ T cells as shown in Extended Data Fig. 1a. b. Frequency of CD4+ and CD8+ TRM cells in unmatched patients with AF compared to SR controls. Patients with post-operative AF were excluded. c. Frequency of CD4+ and CD8+ TRM cells in normotensive (N) compared to hypertensive (HTN) patients. d. Frequency of CD4+ and CD8+ TRM cells between patients undergoing VR or CABG surgery. b-d. Significance was obtained using two-tailed Mann-Whitney test. Data is represented as Mean ± SD e-f. Correlation analysis of CD4+ and CD8+ TRM cells with age (d) and BMI (e) by lineal regression and two-tailed p-value analysis. g-h. Gating strategy for the identification of cytokine production by CD4+ (f) or CD8+ (g) T cells TRM cells. i. Correlation analysis of IL22 production with the frequency of CD4+ TRM cells measured by lineal regression and two-tailed p-value analysis. j. Correlation analysis of IFNγ production with the frequency of CD8+ TRM cells measured by lineal regression and two-tailed p-value analysis. b-i. Data shows individual patients (n=122).
Extended Data Fig. 3
Extended Data Fig. 3. Distinct protein profile across immune cells in EAT and AA.
a. UMAP plots of EAT and AA samples identifying similar 19 cell clusters. b. Bubbleplotshowing surface expression of antibody-derived tag protein expression value for selective markers. c. UMAP plot representation of antibody-derived tag protein expression value for selective markers for the identification of memory T cells, B and myeloid cells. Colour bar key represents average expression levels. Expression values are normalized for quantitative comparison within each dataset. d. TCR clonal overlap detected by the Morisita index. e. Bar graph indicates the relative abundance of TCRβ clonotypes in paired tissues EAT, AA and Blood (BLD). The relative abundance of TCRβ clonotypes. f. TCRβ diversity between paired tissues. Statistical significance was evaluated with 2-way Anova followed Benjamini-Hochberg-correction. g. Heatmap illustrating the compositional TCRβ similarity between paired samples assessed using the Morisita-Horn index. Colour bar key represents the Morisita index. h. Bar graph indicates the relative abundance of TCRβ clonotypes between patients with AF and on SR. Data are presented as mean values ± SD. e-h. Statistical significance was evaluated using 2-way ANOVA with Sidak’s multiple comparisons test. i. TCRβ diversity between AF and SR patients. Statistical significance was evaluated using the two-tailed Mann-Whitney U test for nonparametric data and represented as mean± SD. e-i. Data are from 5 biological replicates.
Extended Data Fig. 4
Extended Data Fig. 4. Spatial transcriptomics.
a. Representative Masson’s Trichrome stains on tissue atrial specimens from 3 patients. b. Representative H&E stains on EAT specimens from 3 patients. c. Representative Masson’s Trichrome stain on tissue specimen at 2.0x magnification with the blue colour depicting the collagen deposition in the EAT/RAA interface and red-brown the atrial tissue from 3 patients. d. Representative immunofluorescent staining used for the identification of regions of interest (ROI) for spatial transcriptomic analysis. Cardiomyocytes were identified by troponin staining (blue), adipocytes by FABP4 expression (green) and immune cells by CD45 (red). e. Dimensionality reduction plots demonstrating sample clustering by type of tissue. f. Absolute number of immune cells in paired EAT and AA tissue samples. Statistical significance was determined by paired two-tailed T test, and data are represented as mean± SD (n=18 biological replicates). g. Bar graph comparing the proportion of cell types over total populations between the AA borderzone and deep in the tissue. h-i. Bar graph comparing the proportion of cell types over total populations between the EAT (h) or AA (i) borderzoneand deep in the tissue between patients with AF and on SR. g-h. Statistical significance was evaluated by two-way ANOVA with Sidak’s multiple comparison test. Bars represent mean±SD. g-i. Assays were performed in 3 biological replicates in technical triplicates. j. Representative immunohistochemistry staining of CCL5.
Extended Data Fig. 5
Extended Data Fig. 5. Characterisation of iPSC-derived atrial cardiomyocytes.
a. Representative immunofluorescence images depicting DAPI (nuclear stain), troponin (TNNT2) and smooth muscle actinin (ACTN2), and the merged images (DAPI) in blue, TNNT2 and ACTN2 in red). Scale bar 50 μM (3 independent experiments). b. Heat map demonstrating the relative expression of key atrial cardiomyocyte genes in independently differentiated cardiomyocyte plates (n=3). c. Atrial cardiomyocyte action potential waveform recorded using the voltage-sensitive dye, di-4-ANEPPS. d. Bar graphs demonstrating percentage change in CaT50 and CaT90 in CD8+ T cells compared to untreated cells. Biological replicates n=6. Statistical significance was assessed using two-tailed t-test for parametric data, represented as mean and SD e. iPSC-cardiomyocytes were cultured directly with TRM cells or in the presence of a 0.4 μM transwell were analysed by RT-PCR. Relative expression levels of selective genes in iPSC-cardiomyocytes (n = 6 biological replicates in triplicates) were analysed by RT-PCR. f. As in e, but bars represent expression of IFNγ−treated iPSC-cardiac fibroblast compared to untreated cells from three independently experiments (n = 9). f-e. Bars represent the mean ratio and upper and lower limits. Statistical significance was determined using unpaired two-tailed t-test. Source data

References

    1. Wijesurendra, R. S. & Casadei, B. Mechanisms of atrial fibrillation. Heart105, 1860–1867 (2019). 10.1136/heartjnl-2018-314267 - DOI - PubMed
    1. Wang, T. J. et al. Temporal relations of atrial fibrillation and congestive heart failure and their joint influence on mortality: the Framingham Heart Study. Circulation107, 2920–2925 (2003). 10.1161/01.CIR.0000072767.89944.6E - DOI - PubMed
    1. Wolf, P. A., Abbott, R. D. & Kannel, W. B. Atrial fibrillation as an independent risk factor for stroke: the Framingham Study. Stroke22, 983–988 (1991). 10.1161/01.STR.22.8.983 - DOI - PubMed
    1. Burdett, P. & Lip, G. Y. H. Atrial fibrillation in the UK: predicting costs of an emerging epidemic recognizing and forecasting the cost drivers of atrial fibrillation-related costs. Eur. Heart J. Qual. Care. Clin. Outcomes8, 187–194 (2022). 10.1093/ehjqcco/qcaa093 - DOI - PubMed
    1. Zhou, X. & Dudley, S. C. Evidence for inflammation as a driver of atrial fibrillation. Front. Cardiovasc. Med.7, 62 (2020). 10.3389/fcvm.2020.00062 - DOI - PMC - PubMed

MeSH terms