. 2024 Sep;3(9):1098-1122.
doi: 10.1038/s44161-024-00533-w. Epub 2024 Sep 13.

Integrative gene regulatory network analysis discloses key driver genes of fibromuscular dysplasia

Affiliations

Integrative gene regulatory network analysis discloses key driver genes of fibromuscular dysplasia

Valentina d'Escamard et al. Nat Cardiovasc Res. 2024 Sep.

Abstract

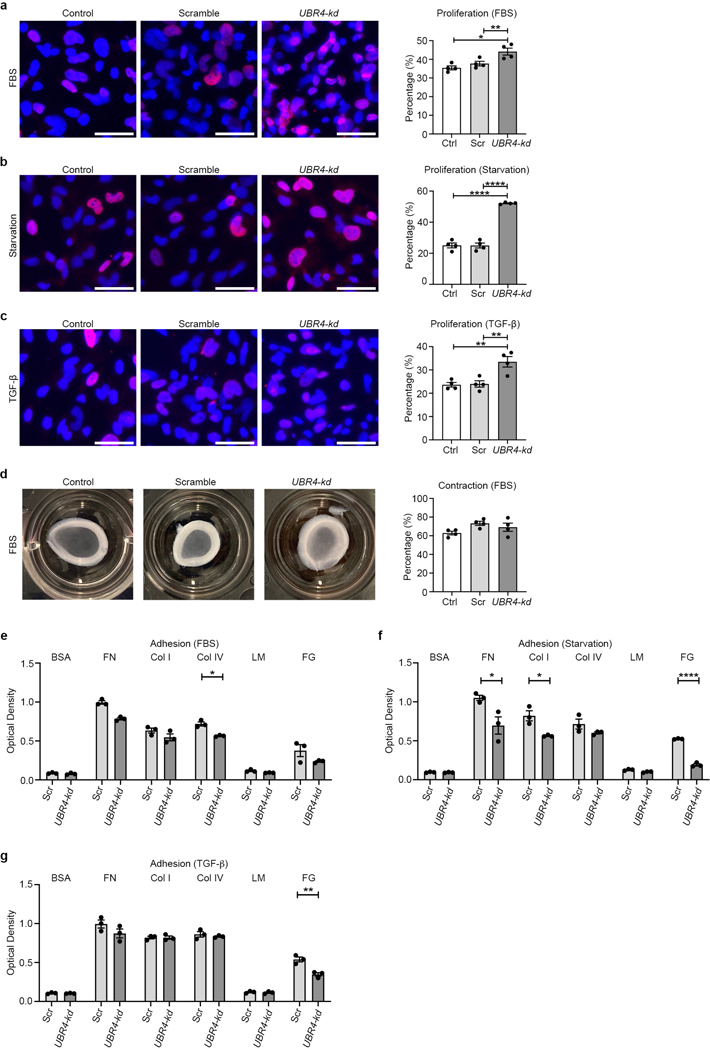
Fibromuscular dysplasia (FMD) is a poorly understood disease affecting 3-5% of adult females. The pathobiology of FMD involves arterial lesions of stenosis, dissection, tortuosity, dilation and aneurysm, which can lead to hypertension, stroke, myocardial infarction and even death. Currently, there are no animal models for FMD and few insights as to its pathobiology. In this study, by integrating DNA genotype and RNA sequence data from primary fibroblasts of 83 patients with FMD and 71 matched healthy controls, we inferred 18 gene regulatory co-expression networks, four of which were found to act together as an FMD-associated supernetwork in the arterial wall. After in vivo perturbation of this co-expression supernetwork by selective knockout of a top network key driver, mice developed arterial dilation, a hallmark of FMD. Molecular studies indicated that this supernetwork governs multiple aspects of vascular cell physiology and functionality, including collagen/matrix production. These studies illuminate the complex causal mechanisms of FMD and suggest a potential therapeutic avenue for this challenging disease.


Conflict of interest statement

Competing Interests Statement

The other authors have no conflicts of interest or relationships with industry to declare.

Figures

Extended Data Figure 1.
Extended Data Figure 1.. Proliferation and contraction of UBR4-kd Bj-5ta fibroblasts.
a-c, Proliferation was evaluated for untreated control Bj-5ta fibroblasts, Bj-5ta fibroblasts treated with lentiviral vector containing scrambled shRNA (Scr), and UBR4-kd Bj-5ta fibroblasts. For these 3 cell types, proliferation was evaluated under 3 conditions: (a) culture with fetal bovine serum (FBS), (b) culture without FBS (starvation), and (c) culture with TGF-β1 at 20 ng/ml. Scale bars: 100 µm. n=3 per group. d-f, Contraction was evaluated for the identical cell groups under the same conditions, respectively: (d) culture with FBS, (e) culture without FBS (starvation), and (f) culture with TGF-β1 at 20 ng/ml. n=4 per group. *P≤0.05; **P≤0.01; ***P≤0.001; ****P≤0.0001. All analyses were performed using one-way ANOVA and Tukey’s post hoc analysis, except for Extended Data Fig. 1a for which the data were not normally distributed and a Kruskal-Wallis test with Dunn’s post hoc analysis were used. Additional statistical information regarding the analyses used in this Figure are provided in Supplementary Table 36.
Extended Data Figure 2.
Extended Data Figure 2.. Adhesion of UBR4-kd Bj-5ta fibroblasts.
a-c, Adhesion was evaluated for Bj-5ta fibroblasts treated with lentiviral vector containing scrambled shRNA (Scr) and UBR4-kd Bj-5ta fibroblasts. For these cell types, adhesion was evaluated under 3 conditions: (a) culture with FBS, (b) culture without FBS (starvation), and (c) culture with TGF-β1 at 20 ng/ml. As per the Cell Biolabs CBA-070 adhesion assay used, adhesion was evaluated when cells were cultured on Bovine Serum Albumin (BSA), Fibronectin (FN), Collagen I (Col I), Collagen IV (Col IV), Laminin I (LM), Fibrinogen (FG). n=3 per group. Based on the distribution and variance of each group, analyses in a-c were performed using unpaired Student’s t test except Col I in b (culture with FBS) that was performed with Mann-Whitney test. d-f, As an alternate method to assess adhesion, the number of cells floating in the supernatant of 2 ml medium (‘Counts’) was evaluated after overnight culture for untreated control Bj-5ta fibroblasts, Bj-5ta fibroblasts treated with lentiviral vector containing scrambled shRNA (Scr), and UBR4-kd Bj-5ta fibroblasts. For these 3 cell types, ‘Counts’ were evaluated under 3 conditions: (d) culture with FBS, (e) culture without FBS (starvation), and (f) culture with TGF-β1 at 20 ng/ml. n=4 per group. Analyses in d-f performed using one-way ANOVA and Tukey’s post hoc analysis. *P≤0.05; **P≤0.01; ****P≤0.0001. Additional statistical information regarding the analyses used in this Figure are provided in Supplementary Table 36.
Extended Data Figure 3.
Extended Data Figure 3.. Apoptosis and senescence of UBR4-kd Bj-5ta fibroblasts.
a-c, Apoptosis was evaluated for untreated control Bj-5ta fibroblasts, Bj-5ta fibroblasts treated with lentiviral vector containing scrambled shRNA (Scr), and UBR4-kd Bj-5ta fibroblasts. For these 3 cell types, apoptosis was evaluated under 3 conditions: (a) culture with FBS, (b) culture without FBS (starvation), and (c) culture with TGF-β1 at 20 ng/ml. Scale bars: 100 µm. n=3 per group. d-f, Senescence was evaluated for the identical cell groups under the same conditions, respectively: (d) culture with FBS, (e) culture without FBS (starvation), and (f) culture with TGF-β1 at 20 ng/ml. Scale bars: 100 µm. n=3 per group. All analyses were performed using Kruskal-Wallis test with Dunn’s post hoc analysis. There were no significant differences for any of these comparisons. Additional statistical information regarding the analyses used in this Figure are provided in Supplementary Table 36.
Extended Data Figure 4.
Extended Data Figure 4.. UBR4-kd Bj-5ta fibroblasts exhibit altered production of extra-cellular matrix-related proteins.
Culture supernatants of Bj-5ta fibroblasts treated with lentiviral vector containing scrambled shRNA (Scr) and UBR4-kd Bj-5ta fibroblasts were evaluated for production of extra-cellular matrix-related proteins. After extensive washing, cells were cultured for 24 hours with serum free medium. Supernatants were collected, frozen, and processed in a single batch by mass spectrometry. In total, 85 extra-cellular matrix and extra-cellular matrix-associated proteins were identified. Shown here is total ion current (TIC) normalized quantitation of extra-cellular matrix-related proteins that showed differential abundance (P≤0.05) in supernatant (i.e. production by fibroblasts) when compared between Scr and UBR4-kd Bj-5ta fibroblasts. n=5 per group. Analyses performed using unpaired Student’s t test.
Extended Data Figure 5.
Extended Data Figure 5.. UBR4 knockdown (UBR4-kd) in immortalized HASMCs including RNAseq, GO terms and hypergeometric test.
a, In vitro gene expression levels of UBR4 by qRT-PCR in untreated control HASMCs (Ctrl), control HASMCs treated with lentiviral vector containing scrambled shRNA (Scr), and HASMCs with stable knockdown of UBR4 (UBR4-kd). n=4, all groups. *P≤0.05; *P≤0.01. Analysis performed using one-way ANOVA and Tukey’s post hoc analysis. b, Volcano plot of DGE between UBR4-kd and scramble control HASMCs based on bulk RNAseq. Selected genes have been labeled including UBR4 (full results in Supplementary Table 11). Blue and purple data points, as well as UBR4 in red, represent the transcripts that were significantly different after multiple comparison testing. n=6 per group. c, Top 10 GO terms (by Bonferroni P value) for genes showing upregulated DGE when comparing UBR4-kd and scramble control HASMCs (full results in Supplementary Table 12). d, Top 10 GO terms (by Bonferroni P value) for genes showing downregulated DGE when comparing UBR4-kd and scramble control HASMCs (full results in Supplementary Table 13). e, Hypergeometric test (the specific test to evaluate if a putative key driver governs a given gene network) comparing the ‘expected’ (dark blue column) versus ‘observed’ (light blue column) number of transcripts showing altered expression levels for genes in SN-A, based on knockdown of UBR4 in HASMCs (i.e. based on RNAseq data shown in Supplementary Table 11). Knockdown of UBR4 in HASMCs resulted in a substantially greater ‘observed’ number of genes with altered expression in SN-A, further validating that UBR4 exerts powerful regulatory control over the genes in this supernetwork (P = 2.51 × 10−93). See also Fig. 3g showing the same analysis performed in Bj-5ta fibroblasts. Additional statistical information regarding the analyses used in this Figure are provided in Supplementary Table 36.
Extended Data Figure 6.
Extended Data Figure 6.. Proliferation, contraction and adhesion of UBR4-kd HASMCs.
a-c, Proliferation was evaluated for untreated control HASMCs, HASMCs treated with lentiviral vector containing scrambled shRNA (Scr), and UBR4-kd HASMCs. For these 3 cell types, proliferation was evaluated under 3 conditions: (a) culture with FBS, (b) culture without FBS (starvation), and (c) culture with TGF-β1 at 20 ng/ml. Scale bars: 50 µm. n=4 per group. Analyses performed using one-way ANOVA and Tukey’s post hoc analysis. d, Contraction assay for the same HASMC groups grown in culture with FBS. n=4 per group. Analysis performed using one-way ANOVA and Tukey’s post hoc analysis. Note that unlike Bj-5ta fibroblasts, we observed that HASMCs grown without FBS (i.e. conditions of either starvation or stimulation with TGF-β1) did not contract. Further assessment revealed that, presumably due to the need for extended culture without FBS, HASMCs in the contraction assay under conditions of either starvation or stimulation with TGF-β1 were no longer viable (see methods). Therefore, only contraction data for HASMCs with FBS is presented. e-g, Adhesion was evaluated for HASMCs treated with lentiviral vector containing scrambled shRNA (Scr) and UBR4-kd HASMCs. For these cell types, adhesion was evaluated under 3 conditions: (e) culture with FBS, (f) culture without FBS (starvation), and (g) culture with TGF-β1 at 20 ng/ml. As per the adhesion assay used, adhesion was evaluated when cells were cultured on Bovine Serum Albumin (BSA), Fibronectin (FN), Collagen I (Col I), Collagen IV (Col IV), Laminin I (LM), Fibrinogen (FG). n=3 per group. Based on the distribution and variance of each group, analyses in e-g were performed using unpaired Student’s t test except FN in e (culture with FBS) and LM in f (culture without FBS (starvation)) that were performed with Mann-Whitney test. *P≤0.05; **P≤0.01; ***P≤0.001; ****P≤0.0001. Additional statistical information regarding the analyses used in this Figure are provided in Supplementary Table 36.
Extended Data Figure 7.
Extended Data Figure 7.. Apoptosis and senescence of UBR4-kd HASMCs.
a-c, Apoptosis was evaluated for untreated control HASMCs, HASMCs treated with lentiviral vector containing scrambled shRNA (Scr), and UBR4-kd HASMCs. For these 3 cell types, apoptosis was evaluated under 3 conditions: (a) culture with FBS, (b) culture without FBS (starvation), and (c) culture with TGF-β1 at 20 ng/ml. Scale bars: 50 µm. n=5–8 per group for a, n=4 per group for b and n=4–5 per group for c. d-f, Senescence was evaluated for the identical cell groups under the same conditions, respectively: (d) culture with FBS, (e) culture without FBS (starvation), and (f) culture with TGF-β1 at 20 ng/ml. Scale bars: 100 µm. n=3 per group. All analyses performed using Kruskal-Wallis test with Dunn’s post hoc analysis except for Extended Data Fig. 7a where all values were 0. There were no significant differences for any of these comparisons. Additional statistical information regarding the analyses used in this Figure are provided in Supplementary Table 36.
Extended Data Figure 8.
Extended Data Figure 8.. UBR4-kd HASMCs exhibit altered production of extra-cellular matrix-related proteins.
Culture supernatants of HASMCs treated with lentiviral vector containing scrambled shRNA (Scr) and UBR4-kd HASMCs were evaluated for production of extra-cellular matrix-related proteins. a, Volcano plot showing proteins with differential abundance in Scr versus UBR4-kd HASMCs (full results in Supplementary Table 14). b, Top 10 GO terms (based on P value) of proteins showing increased abundance in supernatant from HASMCs with UBR4-kd versus Scr control HASMCs. Note that the top 10 GO terms were all GOCC terms, and all GO terms in this Figure showed positive fold enrichment (full results in Supplementary Table 15). c, Top 10 GO terms (based on P value) of proteins showing decreased abundance in supernatant from HASMCs with UBR4-kd versus Scr control SMCs. All GO terms in this Figure showed positive fold enrichment (full results in Supplementary Table 16). n=6 per group.
Extended Data Figure 9.
Extended Data Figure 9.. Single cell RNA sequencing (scRNAseq) of arterial tissues from female tdT-Sm22α-Ubr4KO and control mice (Sm22α-CreERT2;tdTomato;Ubr4flox/flox and Sm22α-CreERT2;tdTomato mice, respectively) showing different cell clustering features.
a, Dotplot of the top 6 marker genes of each major cell type identified in the scRNAseq data (EC, endothelial cells; SMC, smooth muscle cells; FB, fibroblasts; Prog, progenitor cells; Mac, macrophages; DC, dendritic cells; TC, T cells; Unk, unknown) grouped by different cell type clusters. b, Composition analysis of tdT+ samples. Experimental replicates are shown separately. c, Composition analysis of tdT- samples. The scRNA-seq experiment has duplicated samples (WT_1, WT_2, KO_1, KO_2). Each sample has pooled aortic and carotid artery tissues from n=2 mice. n=8 female mice were used for the entire analysis. KO, knockout mice (i.e. tdT-Sm22α-Ubr4KO mice); WT, control mice.
Extended Data Figure 10.
Extended Data Figure 10.. Single cell RNA sequencing (scRNAseq) of arterial tissues from female tdT-Sm22α-Ubr4KO and control mice showing GO terms and differential gene expression for specific cell types and cell clusters.
a, GOBP enrichment for upregulated (left) and downregulated (right) genes in SMC_1 compared to SMC_2–6. b, GOBP enrichment for upregulated (left) and downregulated (right) genes in SMC_7 compared to SMC_2–6. c, Volcano plot showing select DGE between tdT-Sm22α-Ubr4KO versus control mice in endothelial cells (for full results see Supplementary Table 26). d, Volcano plot showing select DGE between tdT-Sm22α-Ubr4KO versus control mice in macrophages (for full results see Supplementary Table 27). e, GOBP enrichment for downregulated genes in macrophages as compared between tdT-Sm22α-Ubr4KO versus control mice.
Figure 1.
Figure 1.. SN-A is an important gene regulatory co-expression supernetwork governing FMD.
a, Catheter-based angiographic image of typical multifocal FMD (‘string-of-beads’) affecting the renal artery. b, Catheter-based angiographic image of FMD in a different patient demonstrating typical multifocal renal FMD with aneurysmal involvement (arrow). Image in b reproduced with permission. c, Overview of study and data analysis workflow. DGE, differential gene expression; GWAS, genome-wide association study; WGCNA, weighted gene co-expression network analysis. The human schematic was from Servier Medical Art, which is licensed under CC BY 4.0. d, Volcano plot of primary fibroblast DGE between FMD cases versus matched controls. Selected genes were individually labeled (full results in Supplementary Table 1). Blue and purple data points represent the 349 transcripts that were significantly different after multiple comparison testing. e, Top 10 GO terms for terms based on P values of DGE between FMD cases and matched controls for genes showing upregulated gene expression, with these 10 GO terms all showing positive enrichment (full results in Supplementary Table 2). GOBP, GO biological process; GOMF, molecular function; GOCC, GO cellular component. f, Top 10 GO terms for terms based on P values of DGE between FMD cases and matched controls for genes showing downregulated gene expression, with these GO terms showing 2 with negative fold enrichment and 8 with positive enrichment (full results in Supplementary Table 3).
Figure 2.
Figure 2.. Visual representation of SN-A, its GO terms, and green and cyan sub-networks.
a, Visual representation of SN-A (complete list of all genes in SN-A is provided in Supplementary Table 4). The top 14 key drivers are labeled as indicated (complete list of SN-A key drivers is provided in Supplementary Table 6). b, Top 10 GO terms (by Bonferroni P value) of genes in SN-A (full results in Supplementary Table 5). c, Alternate visual representation of SN-A. The top 14 key drivers are labeled as indicated. Note that the current software used to create network visualizations does not permit all genes in each network to be represented, and less than half of the 775 genes in SN-A are shown in either 2a or 2c. d, Visualization of the green network. The green network is one of the 4 networks that comprise SN-A and includes UBR4, which is indicated by a red arrow. e, Visualization of the cyan network. The cyan network is another of the 4 networks that comprise SN-A. Note that of the 4 networks that comprise SN-A, three are quite small. Specifically, and as stated in Table 2, green has 418 genes (including UBR4), but cyan, light cyan and tan have only 136, 78 and 143 genes respectively. Mainly due to size, it is only technically possible to create network visualizations for the green and cyan modules.
Figure 3.
Figure 3.. UBR4 is a key driver of SN-A and shows robust expression in SMCs of adult human arteries.
a-c, Expression levels of the top 14 key drivers of SN-A in GTEx aorta (n=224), tibial artery (n=332) and coronary artery samples (n=133), respectively. CPM = counts per million mapped reads. Statistical comparison of these expression levels as well as details of the box plots are presented in Supplementary Table 7, with levels of UBR4 being consistently higher than all other key driver genes in all 3 tissues (P < 4 × 10⁻⁸ for all comparisons). d, Volcano plot of DGE between UBR4-kd Bj-5ta fibroblasts and scramble control cells. Selected genes were labeled including UBR4 (full results in Supplementary Table 8). Blue and purple data points, as well as UBR4 in red, represent the transcripts that were significantly different after multiple comparison testing. n=6 per group. e, Top 10 GO terms (by Bonferroni P value) for genes showing upregulated DGE when comparing UBR4-kd Bj-5ta fibroblasts and control cells (full results in Supplementary Table 9). f, Top 10 GO terms (by Bonferroni P value) for genes showing downregulated DGE when comparing UBR4-kd Bj-5ta fibroblasts and control cells (full results in Supplementary Table 10). g, Hypergeometric test comparing the ‘expected’ (dark blue column) versus ‘observed’ (light blue column) number of transcripts showing altered expression levels for genes in SN-A, based on knockdown of UBR4 in Bj-5ta fibroblasts (i.e., based on data in Supplementary Table 8). Knockdown of UBR4 in Bj-5ta fibroblasts resulted in a substantially greater ‘observed’ number of genes with altered expression in SN-A (P = 2.23 × 10−165). See also Extended Data Figure 5e showing the same analysis performed in HASMCs. h-i, Representative immunofluorescence staining images for SM22α (green), UBR4 (red) and DAPI-stained nuclei (blue), in adult human internal mammary artery (IMA, h) and renal artery (RA, i), showing robust expression of UBR4 in adult human vascular SMCs. j-k, Representative immunofluorescence staining images for PDGFRα (green), UBR4 (red) and DAPI-stained nuclei (blue), in adult human IMA (j) and RA (k), corroborating the robust expression of UBR4 in adult human vascular SMCs. l-m, Representative immunofluorescence staining images for CD31 (green), UBR4 (red) and DAPI-stained nuclei (blue), in adult human IMA (l) and RA (m), showing that adult human arterial endothelial cells also express UBR4. n-o, Representative immunofluorescence staining images for CD90 (green), UBR4 (red) and DAPI-stained nuclei (blue), in adult human IMA (n) and RA (o), showing expression of UBR4 in adventitial fibroblasts. For h-o scale bars: 30μm. L = lumen; M = media; A = adventitia. Smaller panels to the right are digital enlargements of the area demarcated by the dashed boxes in the adjacent merged images. Each immunofluorescence staining microscopy experiment and antibody combination shown in 3h-o was independently repeated a minimum of 3 occasions.
Figure 4.
Figure 4.. In vivo perturbation of SN-A by SMC-specific Ubr4 knockout in female mice (Sm22α-Ubr4KO) recapitulates the arterial dilation phenotype of FMD.
All images, tissues and data in this Figure, with the exception of 4e, are from female mice examined 5 months after tamoxifen administration (mice were then 6 months of age). a, Breeding and generation of Sm22α-Ubr4KO mice (Sm22α-CreERT2;Ubr4flox/flox). Mice schematics were from Servier Medical Art, which is licensed under CC BY 4.0. b, Representative immunofluorescence staining images for UBR4 (red), and DAPI-stained nuclei (blue) in the ascending aorta from Sm22α-Ubr4KO and littermate control mice. Scale bars: 100μm. c, Representative immunofluorescence staining images for UBR4 (red), SM22α (green) and DAPI-stained nuclei (blue) in the ascending aorta from control and Sm22α-Ubr4KO mice. Smaller adjacent panels are digital enlargements of the area demarcated by the dashed boxes in the larger merged images. Scale bars: 20μm. Each immunofluorescence staining microscopy experiment and antibody combination was independently repeated a minimum of 3 occasions. d, Representative in situ fluorescent hybridization images for UBR4 (red), SM22α (green) and DAPI-stained nuclei (blue) in the ascending aorta from control and Sm22α-Ubr4KO mice. Smaller adjacent panels are digital enlargements of the area demarcated by the dashed boxes in the larger merged images. Scale bars: 20μm. e, Gene expression levels of Ubr4 by qRT-PCR in whole mouse aorta from Sm22α-Ubr4KO and littermate control mice at 7 weeks after tamoxifen administration (11 weeks of age). n=5, both groups. f, Representative echocardiographic images of the aortic root and thoracic aorta of Sm22α-Ubr4KO mice and littermate controls. These images are relevant to panels g-k. AoAn, aortic annulus; SOV, sinus of Valsalva; STJ, sino-tubular junction; AoAsc, ascending aorta; AoDesc, descending (thoracic) aorta. Scale bars: 1mm. g-k, Comparisons of aortic annulus, sinus of Valsalva, sino-tubular junction, ascending aorta and descending (thoracic) aortic dimensions, respectively. n=10 controls vs. 11 Sm22α-Ubr4KO for 4g-j, and 7 controls vs. 8 Sm22α-Ubr4KO for 4k. l, Representative echocardiographic images of the abdominal aorta of Sm22α-Ubr4KO mice and littermate controls. Scale bars: 500μm. m, Comparison of abdominal aortic diameter of Sm22α-Ubr4KO mice and littermate controls. n=10 controls vs. 11 Sm22α-Ubr4KO. n, Representative histopathological images of ascending aortic sections of Sm22α-Ubr4KO mice and littermate controls using hematoxylin and eosin staining. These images are relevant to panels o-t. Scale bars: 100 μm. o-t, Comparisons of ascending aorta inner perimeter length, outer perimeter length (medial/adventitial boundary), medial area, calculated lumen area (assuming the vessel was circular in cross-section), tortuosity of the elastic laminae (EL tortuosity index) and number of EL, respectively. n=8 controls vs. 9 Sm22α-Ubr4KO for 4o-r, 10 controls vs. 10 Sm22α-Ubr4KO for 4s, and 10 controls vs. 9 Sm22α-Ubr4KO for 4t. u, Representative histopathological images of ascending aortic sections of Sm22α-Ubr4KO mice and littermate controls using Van Gieson’s stain for EL staining. These images are relevant to panel v. Scale bars: 100 μm. v, Comparison of breaks in the EL for the ascending aorta of Sm22α-Ubr4KO mice and littermate controls. n=8 controls vs. 10 Sm22α-Ubr4KO. w, Representative histopathological images of ascending aortic sections of Sm22α-Ubr4KO mice and littermate controls using Masson’s trichrome staining to demonstrate collagen content. Scale bars: 100 μm. These images are relevant to panel x. x, Statistical comparison of w for collagen content. n=10 controls vs. 7 Sm22α-Ubr4KO mice. All mice shown in this Figure received an identical course of tamoxifen administration (knockout mice and littermate controls) that was also the same as administered to mice shown in Figs. 5 and 6. Based on the distribution and variance of each group, all analyses were performed using unpaired Student’s t test except 4g, 4k, 4m, 4t and 4v that were performed with Mann-Whitney test. *P≤0.05; **P≤0.01; ***P≤0.001; ****P≤0.0001. Purple columns represent control groups, orange columns represent Sm22α-Ubr4KO groups. Additional statistical information regarding the analyses used in this Figure are provided in Supplementary Table 36.
Figure 5.
Figure 5.. In vivo perturbation of SN-A by SMC-specific Ubr4 knockout in male SMMHC-Ubr4KO mice validates an arterial dilation phenotype.
All images, tissues and data in this Figure are from male mice examined 5 months after tamoxifen administration (mice were then 6 months of age). a, Breeding and generation of SMMHC-Ubr4KO mice (SMMHC-CreERT2;Ubr4flox/flox). Mice schematics were from Servier Medical Art, which is licensed under CC BY 4.0. b, Representative immunofluorescence staining for UBR4 (red), and DAPI-stained nuclei (blue) in the ascending aorta from SMMHC-Ubr4KO and littermate control mice. Scale bars: 100μm. Immunofluorescence staining was independently repeated on 2 occasions. c, Representative echocardiographic images of the aortic root and thoracic aorta of SMMHC-Ubr4KO and littermate control mice. These images are relevant to panels d-h. Scale bars: 1 mm. d-h, Comparisons of aortic annulus, sinus of Valsalva, sino-tubular junction, ascending aorta and descending (thoracic) aortic dimensions, respectively. n=5 controls vs. 6 SMMHC-Ubr4KO for 5d-f, and 4 controls vs. 6 SMMHC-Ubr4KO for 5g,h. i, Representative echocardiographic images of the abdominal aorta from SMMHC-Ubr4KO and littermate controls. Scale bars: 500μm. j, Comparison of abdominal aortic diameter of SMMHC-Ubr4KO mice and littermate controls. n=5 controls vs. 6 SMMHC-Ubr4KO. k, Representative histopathological images of ascending aortic sections of SMMHC-Ubr4KO and littermate control mice using hematoxylin and eosin staining. These images are relevant to panels l-q. Scale bars: 100 μm. l-q, Comparisons of ascending aorta inner perimeter length, outer perimeter length (medial/adventitial boundary), medial area, calculated lumen area (assuming the vessel was circular in cross-section), tortuosity of the EL and number of EL, respectively. n=7 for both groups for 5l-q. r, Representative histopathological images of ascending aortic sections of SMMHC-Ubr4KO mice and littermate controls using Van Gieson’s stain for EL staining. These images are relevant to panel s. Scale bars: 100 μm. s, Comparison of EL breaks for the ascending aorta of SMMHC-Ubr4KO mice and littermate controls. n=10 controls vs. 10 Sm22α-Ubr4KO. t, Representative histopathological images of ascending aortic sections of SMMHC-Ubr4KO mice and littermate controls using Masson’s trichrome staining for collagen content. Scale bars: 100 μm. These images are relevant to panel u. u, Statistical comparison of t. n=10 controls vs. 8 SMMHC-Ubr4KO mice. Based on the distribution and variance of each group, all analyses were performed using unpaired Student’s t test except 5j that was performed with Mann-Whitney test, and 5g and 5n that were performed with Welch’s t test. *P≤0.05; **P≤0.01; ***P≤0.001; ****P≤0.0001. Green columns represent control groups, blue columns represent SMMHC-Ubr4KO groups. Additional statistical information regarding the analyses used in this Figure are provided in Supplementary Table 36.
Figure 6.
Figure 6.. Single cell RNA sequencing (scRNAseq) of arterial tissues from tdT-Sm22α-Ubr4KO and control mice confirms that SMC-specific Ubr4 knockout leads to changes in extracellular collagen/matrix and also in specific SMC clusters.
ScRNAseq of tdT-Sm22α-Ubr4KO and control mice (Sm22α-CreERT2;tdTomato;Ubr4flox/flox and Sm22α-CreERT2;tdTomato mice, respectively) was performed with n=2 mice per group (a total of n=8 mice were used for this entire analysis). a, Uniform Manifold Approximation and Projection (UMAP) showing annotation of differing cell clusters. EC, endothelial cells; SMC, smooth muscle cells; FB, fibroblasts; Prog, progenitor cells; Mac, macrophages; DC, dendritic cells; TC, T cells; Unk, unknown. b, UMAP colored by the tdTomato (tdT) fluorescence of the cells (Red, tdT positive [tdT+]; Blue, tdT negative [tdT-]), confirming that tdT+ cells mostly comprised SMCs. c, UMAP colored by genotype of the cells, with the total dots representing all cells identified across tdT-Sm22α-Ubr4KO and control mice in both tdT+ and tdT- cells, and turquoise dots representing those cells identified only in control mice (both tdT+ and tdT- cells). WT (wild type) = cells from control mice. d, UMAP colored by genotype of the cells, with the total dots representing all cells identified across tdT-Sm22α-Ubr4KO and control mice in both tdT+ and tdT- cells (as also in c), and orange dots representing those cells identified only in tdT-Sm22α-Ubr4KO mice (both tdT+ and tdT- cells). Ko (knockout) = cells from tdT-Sm22α-Ubr4KO mice. e, Volcano plot showing select DGE between tdT-Sm22α-Ubr4KO and control mice among all SMC clusters in the scRNAseq data. f, GOBP enrichment for downregulated genes in SMCs of tdT-Sm22α-Ubr4KO versus control mice. g, Dotplot showing select differentially expressed genes in the scRNAseq data that overlap with genes in SN-A. All cells in the scRNAseq data were scored using mouse orthologs of SN-A genes to generate an SN-A score, which is shown in the dotplot. h, Volcano plot showing select DGE between tdT-Sm22α-Ubr4KO and control mice among tdT+ fibroblasts. i, GOBP enrichment for upregulated genes in tdT+ fibroblasts of Sm22α-Ubr4KO versus control mice. STK, serine/threonine kinase. j, Volcano plot showing select DGE between tdT-Sm22α-Ubr4KO versus control mice among tdT- fibroblasts. k, GOBP enrichment for upregulated genes in tdT- fibroblasts of tdT-Sm22α-Ubr4KO versus control mice.

References

    1. Sottiurai VS, Fry WJ & Stanley JC Ultrastructure of medial smooth muscle and myofibroblasts in human arterial dysplasia. Arch Surg 113, 1280–8 (1978). - PubMed
    1. Olin JW et al. The United States Registry for Fibromuscular Dysplasia: results in the first 447 patients. Circulation 125, 3182–90 (2012). - PubMed
    1. Pappaccogli M et al. The European/International Fibromuscular Dysplasia Registry and Initiative (FEIRI)-clinical phenotypes and their predictors based on a cohort of 1000 patients. Cardiovasc Res 117, 950–959 (2021). - PubMed
    1. Gornik HL et al. First International Consensus on the diagnosis and management of fibromuscular dysplasia. Vasc Med 24, 164–189 (2019). - PubMed
    1. Hendricks NJ et al. Is fibromuscular dysplasia underdiagnosed? A comparison of the prevalence of FMD seen in CORAL trial participants versus a single institution population of renal donor candidates. Vasc Med 19, 363–7 (2014). - PubMed

LinkOut - more resources