. 2024 Sep;3(9):1158-1176.
doi: 10.1038/s44161-024-00538-5. Epub 2024 Sep 13.

The innate immune regulator MyD88 dampens fibrosis during zebrafish heart regeneration

Affiliations

The innate immune regulator MyD88 dampens fibrosis during zebrafish heart regeneration

Pinelopi Goumenaki et al. Nat Cardiovasc Res. 2024 Sep.

Abstract

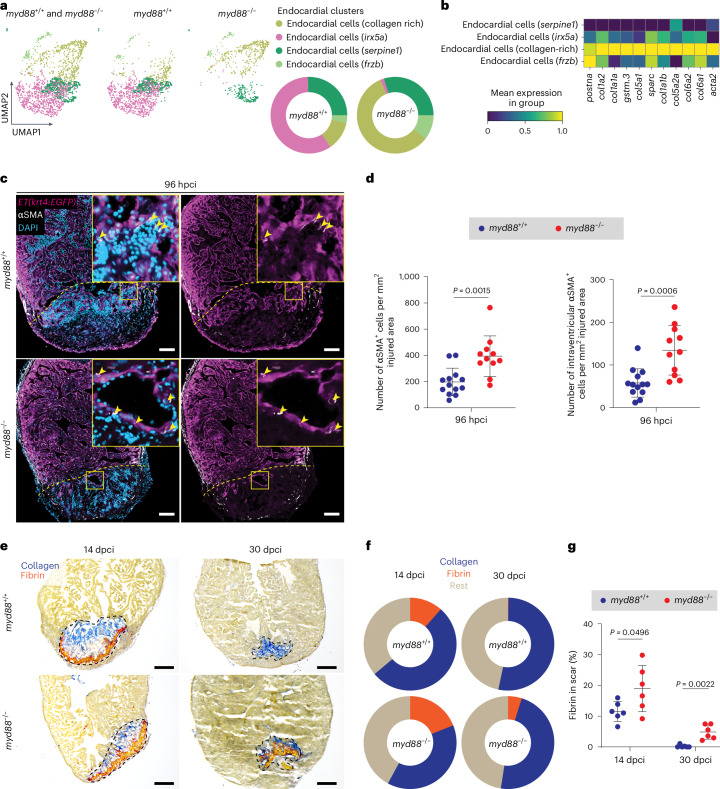
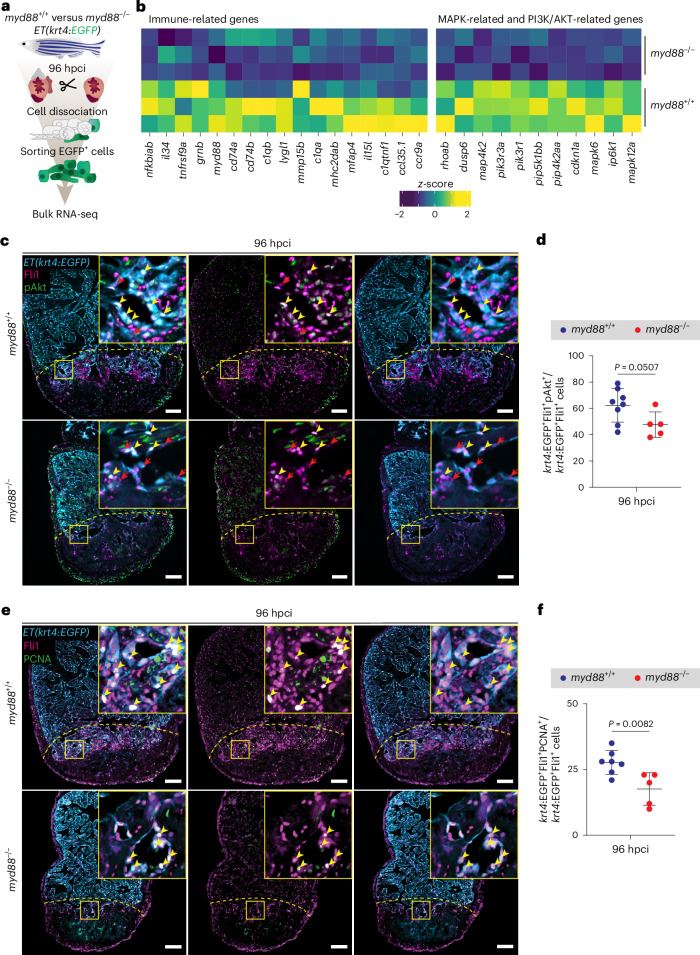
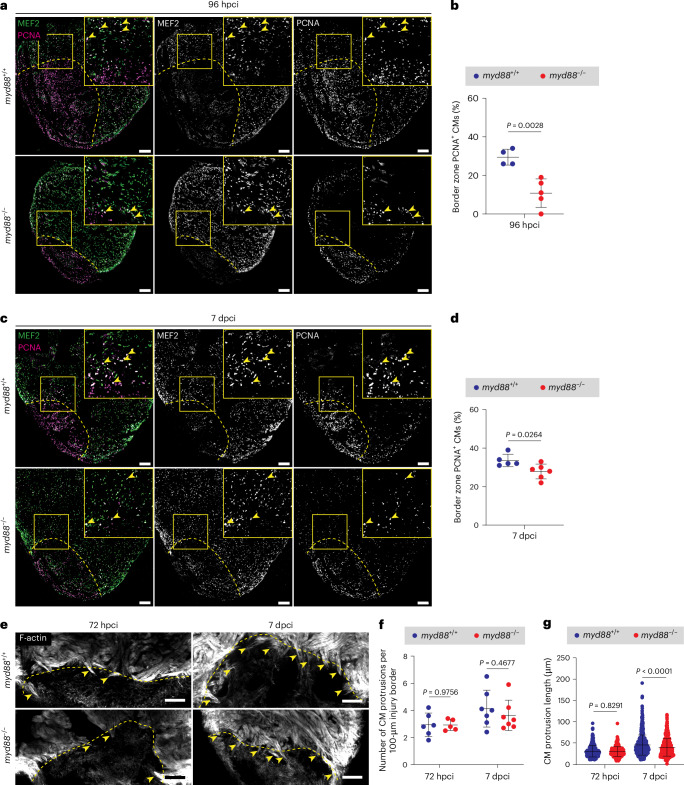
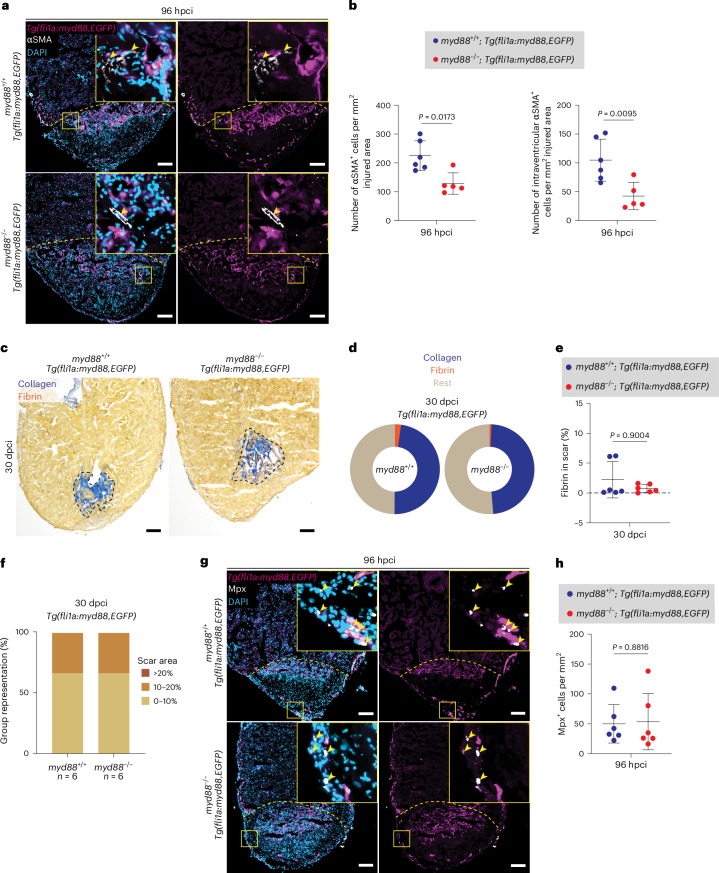
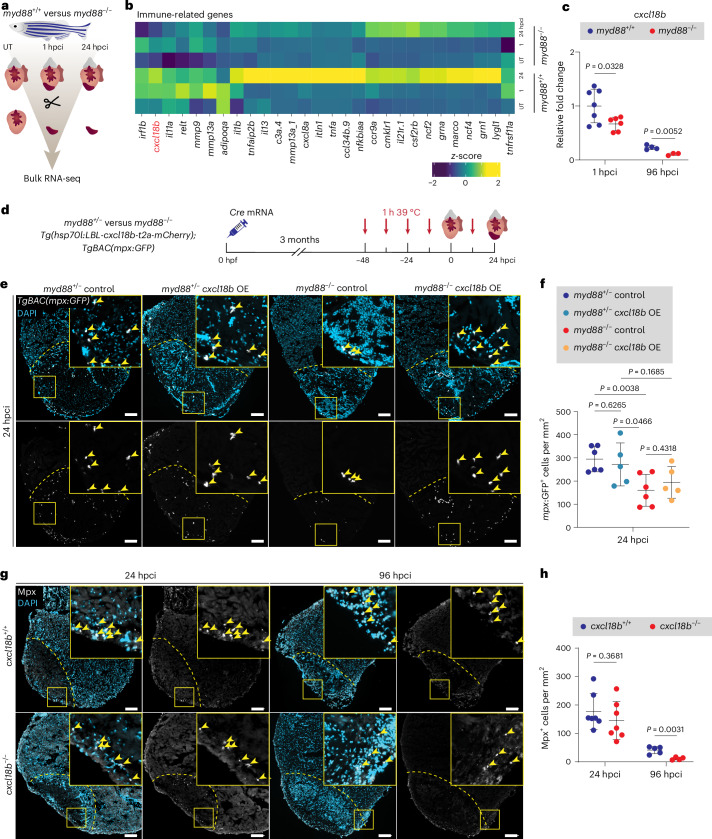
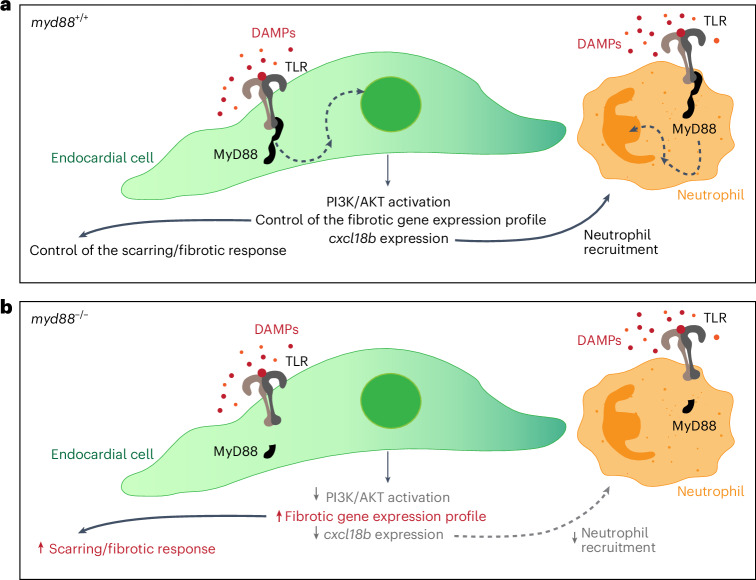
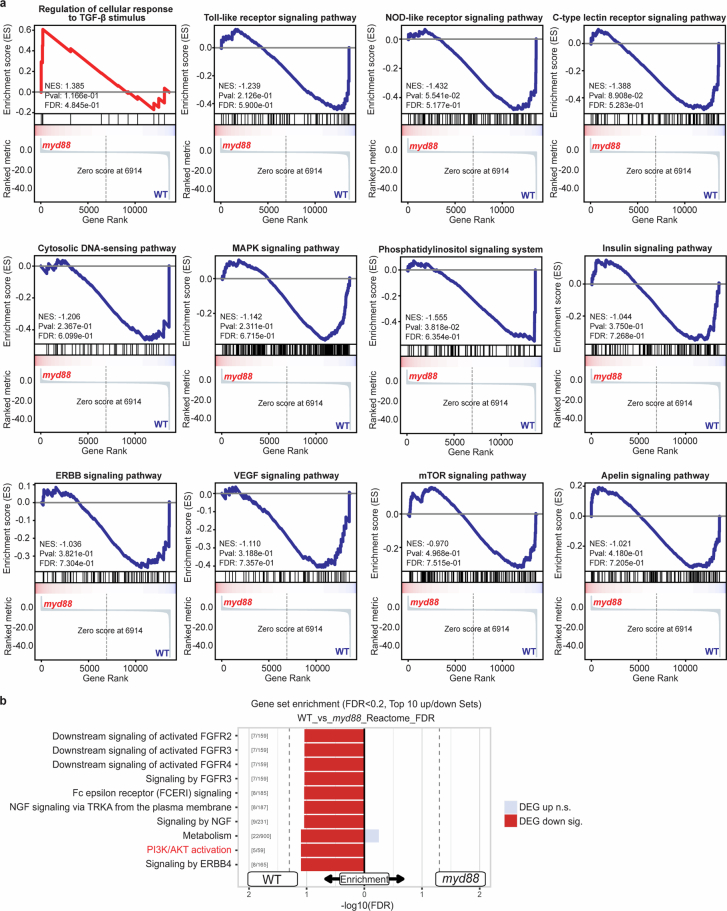
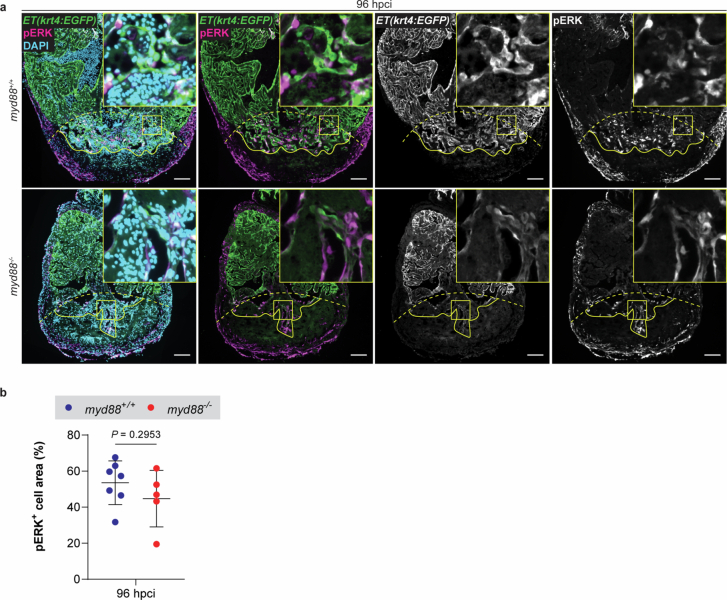
The innate immune response is triggered rapidly after injury and its spatiotemporal dynamics are critical for regeneration; however, many questions remain about its exact role. Here we show that MyD88, a key component of the innate immune response, controls not only the inflammatory but also the fibrotic response during zebrafish cardiac regeneration. We find in cryoinjured myd88-/- ventricles a significant reduction in neutrophil and macrophage numbers and the expansion of a collagen-rich endocardial population. Further analyses reveal compromised PI3K/AKT pathway activation in the myd88-/- endocardium and increased myofibroblasts and scarring. Notably, endothelial-specific overexpression of myd88 reverses these neutrophil, fibrotic and scarring phenotypes. Mechanistically, we identify the endocardial-derived chemokine gene cxcl18b as a target of the MyD88 signaling pathway, and using loss-of-function and gain-of-function tools, we show that it controls neutrophil recruitment. Altogether, these findings shed light on the pivotal role of MyD88 in modulating inflammation and fibrosis during tissue regeneration.


Conflict of interest statement

The authors declare no competing interests.

Figures

Fig. 1
Fig. 1. Reduced numbers of pro-inflammatory cells in cryoinjured myd88−/− ventricles.
a, Experimental plan for the scRNA-seq analysis performed in cryoinjured myd88+/+ and myd88−/− ventricles at 24 hpci. b, Uniform manifold approximation and projection (UMAP) representation of the scRNA-seq clustering results. c, Heatmap showing the expression levels of the gene markers for the different cell types. d, UMAP representation of the myeloid subclusters from the scRNA-seq analysis. Areas (i) and (ii) enclose myeloid populations reduced in myd88−/− ventricles. The pie charts show the proportions of different myeloid subclusters. e, Heatmap showing inflammatory gene (il1b, cxcl8a, ifngr1, timp2b, ptgs2a) expression levels in the myeloid subclusters. f, Representative images of GFP (neutrophils, white), with DAPI (DNA marker, blue) counterstaining on sections of cryoinjured TgBAC(mpx:GFP); myd88+/+ and TgBAC(mpx:GFP); myd88−/− ventricles at 24 and 96 hpci. GFP; immunostaining for green fluorescent protein. g, mpx:GFP+ cell numbers in myd88+/+ and myd88−/− injured tissues and border zone areas (100 μm) at 24 and 96 hpci. The dots in the graph represent individual ventricles; data are shown as the mean ± s.d.; n = 9 myd88+/+ and n = 7 myd88−/− for 24 hpci; n = 7 myd88+/+ and n = 8 myd88−/− for 96 hpci. Statistical tests: Student’s t-test for 24 hpci and Mann–Whitney U-test for 96 hpci. h, Representative images of immunostaining for EGFP (macrophages, white) with DAPI (DNA marker, blue) counterstaining on sections of cryoinjured Tg(mpeg1:EGFP); myd88+/+ and Tg(mpeg1:EGFP); myd88−/− ventricles at 24 and 96 hpci. i, mpeg1:EGFP+ cell numbers in myd88+/+ and myd88−/− injured tissues and border zone areas (100 μm) at 24 and 96 hpci. The dots in the graph represent individual ventricles; data are shown as the mean ± s.d.; n = 4 myd88+/+ and n = 5 myd88−/− for 24 hpci; n = 5 myd88+/+ and n = 5 myd88−/− for 96 hpci. Statistical tests: Student’s t-test. The yellow dashed lines delineate the injured area; the yellow arrowheads point to mpx:GFP+ (f) and mpeg1:EGFP+ (h) cells. Scale bars, 100 μm. Source data
Fig. 2
Fig. 2. Fibrotic phenotype in cryoinjured myd88−/− ventricles.
a, UMAP representation of the endocardial subclusters from the scRNA-seq analysis. The pie charts show the proportions of different endocardial subclusters. b, Heatmap showing fibrotic gene (postna, col1a2, col1a1a, gstm.3, col5a1, sparc, col1a1b, col5a2a, col6a2, col6a1, acta2) expression levels in the endocardial subclusters. c, Representative images of immunostaining for EGFP (endocardial cells, magenta) and αSMA (myofibroblasts, white) with DAPI (DNA marker, blue) counterstaining on sections of cryoinjured ET(krt4:EGFP); myd88+/+ and ET(krt4:EGFP); myd88−/− ventricles at 96 hpci. d, Total number of αSMA+ cells and intraventricular αSMA+ cells in myd88+/+ and myd88−/− injured tissues at 96 hpci. The dots in the graphs represent individual ventricles; data are shown as the mean ± s.d.; n = 13 myd88+/+ and n = 11 myd88−/−. Statistical tests: Student’s t-test. e, Representative images of AFOG staining on sections of cryoinjured myd88+/+ and myd88−/− ventricles at 14 and 30 dpci. f, Pie charts showing the proportion of scar components (collagen, blue; fibrin, red; rest of cells and tissue, light brown) in myd88+/+ and myd88−/− scars; n = 6 myd88+/+ and n = 6 myd88−/− for both 14 and 30 dpci. g, Graph showing the percentage of the fibrin/scar area at 14 and 30 dpci. The dots in the graph represent individual ventricles; data are shown as the mean ± s.d.; n = 6 myd88+/+ and n = 6 myd88−/−. Statistical test: Student’s t-test. The yellow dashed lines delineate the injured area and the black dashed lines the scar area; the yellow arrowheads point to αSMA+ cells. Scale bars, 100 μm (c), 200 μm (e). Source data
Fig. 3
Fig. 3. The PI3K/AKT signaling pathway is suppressed in the myd88−/− endocardium.
a, Experimental plan for bulk RNA-seq analysis on sorted endocardial cells from ET(krt4:EGFP); myd88+/+ and ET(krt4:EGFP); myd88−/− ventricles at 96 hpci. b, Heatmap showing differential expression of significantly (P < 0.05) downregulated genes in the myd88−/− endocardium at 96 hpci. c, Representative images of immunostaining for EGFP (endocardial cells, blue), Fli1 (endothelial cell nuclei, magenta) and pAkt (phosphoAkt, green) on sections of cryoinjured ET(krt4:EGFP); myd88+/+ and ET(krt4:EGFP); myd88−/− ventricles at 96 hpci. d, krt4:EGFP+Fli1+pAkt+/krt4:EGFP+Fli1+ cell percentage in myd88+/+ and myd88−/− 50-μm-wide areas on the basal-most side of the injured tissue at 96 hpci. The dots in the graph represent individual ventricles; data are shown as the mean ± s.d.; n = 8 myd88+/+ and n = 5 myd88−/−. Statistical test: Student’s t-test. e, Representative images of immunostaining for EGFP (endocardial cells, blue), Fli1 (endothelial cell nuclei, magenta) and PCNA (proliferation marker, green) on sections of cryoinjured ET(krt4:EGFP); myd88+/+ and ET(krt4:EGFP); myd88−/− ventricles at 96 hpci. f, krt4:EGFP+Fli1+PCNA+/krt4:EGFP+Fli1+ cell percentage in myd88+/+ and myd88−/− 50-μm-wide areas on the basal-most side of the injured tissue at 96 hpci. The dots in the graph represent individual ventricles; data are shown as the mean ± s.d.; n = 7 myd88+/+ and n = 5 myd88−/−. Statistical test: Student’s t-test. The yellow dashed lines delineate the injured area; the yellow arrowheads point to krt4:EGFP+Fli1+pAkt+ (c) and krt4:EGFP+Fli1+PCNA+ (e) cells; the red arrowheads (c) point to krt4:EGFP+Fli1+pAkt cells. Scale bars, 100 μm. Source data
Fig. 4
Fig. 4. Reduced CM proliferation and reduced length of CM protrusions toward the injured tissue in cryoinjured myd88−/− ventricles.
a,c, Representative images of immunostaining for MEF2 (CM nuclei, green) and PCNA (proliferation marker, magenta) on sections of cryoinjured myd88+/+ and myd88−/− ventricles at 96 hpci (a) and 7 dpci (c). b,d, Quantification of proliferating CMs in border zone areas (100 μm) at 96 hpci (b) and 7 dpci (d). The dots in the graphs represent individual ventricles; data are shown as the mean ± s.d.; n = 4 myd88+/+ and n = 5 myd88−/− (b); n = 5 myd88+/+ and n = 6 myd88−/− (d). Statistical tests: Student’s t-test. e, Representative images of phalloidin staining for F-actin (white) on 50-μm-thick sections of cryoinjured myd88+/+ and myd88−/− ventricles at 72 hpci and 7 dpci. f, Quantification of the number of CM protrusions. The dots in the graph represent individual ventricles; data are shown as the mean ± s.d.; n = 6 myd88+/+ and n = 5 myd88−/− for 72 hpci; n = 7 myd88+/+ and n = 7 myd88−/− for 7 dpci. Statistical tests: Student’s t-test. g, Quantification of CM protrusion length. The dots in the graph represent individual CM protrusions; data are shown as the mean ± s.d.; n = 366 myd88+/+ and n = 274 myd88−/− for 72 hpci; n = 633 myd88+/+ and n = 459 myd88−/− for 7 dpci. Statistical tests: Mann–Whitney U-test. The yellow dashed lines delineate the injured area; the yellow arrowheads point to proliferating (a,c) and protruding (e) CMs. Scale bars, 100 μm. Source data
Fig. 5
Fig. 5. myd88 overexpression in endothelial cells rescues the fibrotic, scarring and neutrophil phenotypes in cryoinjured myd88−/− ventricles.
a, Representative images of immunostaining for EGFP (endothelial cells, magenta) and αSMA (myofibroblasts, white) with DAPI (DNA marker, blue) counterstaining on sections of cryoinjured Tg(fli1a:myd88,EGFP); myd88+/+ and Tg(fli1a:myd88,EGFP); myd88−/− ventricles at 96 hpci. b, Total number of αSMA+ cells and of intraventricular αSMA+ cells in Tg(fli1a:myd88,EGFP); myd88+/+ and Tg(fli1a:myd88,EGFP); myd88−/− injured tissues at 96 hpci. The dots in the graphs represent individual ventricles; data are shown as the mean ± s.d.; n = 6 Tg(fli1a:myd88,EGFP); myd88+/+ and n = 5 Tg(fli1a:myd88,EGFP); myd88−/−. Statistical tests: Student’s t-test. c, Representative images of AFOG staining on sections of cryoinjured Tg(fli1a:myd88,EGFP); myd88+/+ and Tg(fli1a:myd88,EGFP); myd88−/− ventricles at 30 dpci. d, Pie charts showing the proportion of scar components (collagen, blue; fibrin, red; rest of cells and tissue, light brown) in Tg(fli1a:myd88,EGFP); myd88+/+ and Tg(fli1a:myd88,EGFP); myd88−/− scars; n = 6 Tg(fli1a:myd88,EGFP); myd88+/+ and n = 6 Tg(fli1a:myd88,EGFP); myd88−/−. e, Graph showing the percentage of fibrin/scar area at 30 dpci. The dots in the graph represent individual ventricles; data are shown as the mean ± s.d.; n = 6 Tg(fli1a:myd88,EGFP); myd88+/+ and n = 6 Tg(fli1a:myd88,EGFP); myd88−/−. Statistical test: Mann–Whitney U-test. f, Graph showing the representation of groups (y axis) of different scar area sizes (different colors) at 30 dpci for cryoinjured Tg(fli1a:myd88,EGFP); myd88+/+ and Tg(fli1a:myd88,EGFP); myd88−/− ventricles. g, Representative images of immunostaining for EGFP (endothelial cells, magenta) and Mpx (neutrophils, white) with DAPI (DNA marker, blue) counterstaining on sections of cryoinjured Tg(fli1a:myd88,EGFP); myd88+/+ and Tg(fli1a:myd88,EGFP); myd88−/− ventricles at 96 hpci. h, Mpx+ cell numbers in Tg(fli1a:myd88,EGFP); myd88+/+ and Tg(fli1a:myd88,EGFP); myd88−/− injured tissues and border zone areas (100 μm) at 96 hpci. The dots in the graph represent individual ventricles; data are shown as the mean ± s.d.; n = 6 Tg(fli1a:myd88,EGFP); myd88+/+ and n = 6 Tg(fli1a:myd88,EGFP); myd88−/−. Statistical test: Student’s t-test. The yellow dashed lines delineate the injured area; the black dashed lines delineate the scar area; the yellow arrowheads point to αSMA+ (a) and Mpx+ (g) cells. Scale bars, 100 μm (a,g), 200 μm (c). Source data
Fig. 6
Fig. 6. cxcl18b is activated by MyD88 signaling and controls neutrophil recruitment.
a, Experimental plan for bulk RNA-seq analysis on myd88+/+ and myd88−/− UT ventricles and injured tissues at 1 and 24 hpci. b, Heatmap showing differential expression of downregulated immune-related genes in myd88−/− UT ventricles and injured tissues at 1 and 24 hpci. c, RT–qPCR analysis of cxcl18b mRNA levels in cryoinjured myd88+/+ and myd88−/− ventricles at 1 and 96 hpci. Data are shown as the mean ± s.d.; n = 7 myd88+/+ and n = 6 myd88−/− for 1 hpci; n = 4 myd88+/+ and n = 3 myd88−/− for 96 hpci. Statistical tests: Student’s t-test. Ct values are listed in Supplementary Table 3. d, Experimental plan for Cre mRNA-injected (cxcl18b overexpression (OE)) or uninjected (control) myd88+/− and Cre mRNA-injected (cxcl18b OE) or uninjected (control) myd88−/− Tg(hsp70l:LBL-cxcl18b-t2a-mCherry); TgBAC(mpx:GFP) siblings at 24 hpci. e, Representative images of immunostaining for GFP (neutrophils, white) with DAPI (DNA marker, blue) counterstaining on sections of cryoinjured myd88+/− control, myd88+/− cxcl18b OE, myd88−/− control and myd88−/− cxcl18b OE TgBAC(mpx:GFP) ventricles at 24 hpci. f, mpx:GFP+ cell numbers in injured tissues and border zone areas (100 μm) at 24 hpci. The dots in the graph represent individual ventricles; data are shown as the mean ± s.d.; n = 6 myd88+/− control, n = 5 myd88+/− cxcl18b OE, n = 6 myd88−/− control and n = 5 myd88−/− cxcl18b OE. Statistical tests: Student’s t-test. g, Representative images of immunostaining for Mpx (neutrophils, white) with DAPI (DNA marker, blue) counterstaining on sections of cryoinjured cxcl18b+/+ and cxcl18b−/− ventricles at 24 and 96 hpci. h, Mpx+ cell numbers in cxcl18b+/+ and cxcl18b−/− injured tissues and border zone areas (100 μm) at 24 and 96 hpci. The dots in the graphs represent individual ventricles; data are shown as the mean ± s.d.; n = 7 cxcl18b+/+ and n = 7 cxcl18b−/− for 24 hpci; n = 5 cxcl18b+/+ and n = 4 cxcl18b−/− for 96 hpci. Statistical tests: Student’s t-test. The yellow dashed lines delineate the injured area; the yellow arrowheads point to mpx:GFP+ (e) and Mpx+ (g) cells. Scale bars, 100 μm. Source data
Fig. 7
Fig. 7. Proposed model for the role of MyD88 in fibrosis and neutrophil recruitment following cardiac cryoinjury in zebrafish.
a, TLRs (and IL-1Rs) recruit the adaptor molecule MyD88 upon ligand interaction. MyD88 in turn initiates signal transduction, which leads to the activation of several processes. In endocardial cells, PI3K/AKT pathway activation and fibrosis are controlled by the MyD88 signaling pathway. Neutrophil count is also partially affected by the levels of the endocardial chemokine Cxcl18b. Immune cells also activate a MyD88-mediated response leading to several processes, including the recruitment of more immune cells and the manifestation of an inflammatory response. b, In myd88−/− injured tissues, the MyD88 signaling pathway is not activated and thus, endocardial cells exhibit decreased activation of the PI3K/AKT pathway. myd88−/− injured tissues also exhibit decreased levels of the endocardial chemokine gene cxcl18b and an increase in features related to fibrosis. In addition, the neutrophil count appears significantly reduced. As the fibrotic and the immune responses are affected, other processes essential for successful regeneration are also impaired, including revascularization and CM proliferation. Source data
Extended Data Fig. 1
Extended Data Fig. 1. Neutrophils and macrophages are affected in cryoinjured myd88−/− ventricles.
a, UMAP representation of the macrophage and neutrophil clusters from the scRNA-seq analysis. b, Violin plots showing expression of known macrophage and neutrophil gene markers. c, Violin plots showing expression of neutrophil-enriched gene markers in the macrophage and neutrophil clusters. Genes selected from published datasets. d, UMAP representation of the myeloid subclusters from the scRNA-seq analysis. Area (iii) corresponds to a macrophage subcluster that is increased in cryoinjured myd88−/− ventricles. e, UMAP representation of this myd88−/− macrophage subcluster (blue) and the other macrophages (orange), and violin plots showing enriched genes in the myd88−/− macrophage subcluster (iii). f, Representative images of immunostaining for GFP (neutrophils, white) with DAPI (DNA marker, blue) counterstaining on sections of TgBAC(mpx:GFP); myd88+/+ and TgBAC(mpx:GFP); myd88−/− ventricles at 6 hps, 6 hpci and 7 dpci. g, mpx:GFP+ cell numbers in TgBAC(mpx:GFP); myd88+/+ and TgBAC(mpx:GFP); myd88−/− ventricles at 6 hps and injured tissues and border zone areas (100 μm) at 6, 24 and 96 hpci, as well as 7 dpci. The dots in the graph represent individual ventricles; data are shown as the mean ± s.d.; n = 4 myd88+/+, n = 5 myd88−/− for 6 hps, n = 5 myd88+/+, n = 5 myd88−/− for 6 hpci, n = 9 myd88+/+, n = 7 myd88−/− for 24 hpci, n = 7 myd88+/+, n = 8 myd88−/− for 96 hpci, and n = 3 myd88+/+, n = 4 myd88−/− for 7 dpci. Statistical tests: Student’s t-test for 6 hps, 6, 24 hpci and 7 dpci, and Mann-Whitney U-test for 96 hpci. h, The pie charts show the proportion of macrophages in the scRNA-seq dataset at 24 hpci. Yellow dashed lines delineate the injured area; yellow arrowheads point to mpx:GFP+ cells. Scale bars, 100 μm. Source data
Extended Data Fig. 2
Extended Data Fig. 2. Fibrotic cell populations in cryoinjured myd88−/− ventricles.
a, Trajectory analysis revealing a potential transition from the serpine1 endocardial cluster to the collagen-rich, irx5a, and frzb endocardial clusters. b, Velocity analysis done by comparing pre-mRNA and mRNA levels to infer the relations between the cells in the endocardial clusters. c, Representative images of immunostaining for αSMA (myofibroblasts, white) with DAPI (DNA marker, blue) counterstaining on sections of cryoinjured myd88+/+ and myd88−/− ventricles at 7 dpci. d, Total αSMA+ cell numbers in myd88+/+ and myd88−/− injured tissues at 7 dpci. The dots in the graph represent individual ventricles; data are shown as the mean ± s.d.; n = 4 myd88+/+ and n = 5 myd88−/−. Statistical test: Student’s t-test. e, Superficially localized αSMA+ cell numbers in myd88+/+ and myd88−/− injured tissues at 96 hpci. The dots in the graph represent individual ventricles; data are shown as the mean ± s.d.; n = 13 myd88+/+ and n = 11 myd88−/−. Statistical test: Mann-Whitney U-test. f, UMAP representation of the mesenchymal subclusters from the scRNA-seq analysis. g, UMAP representation of acta2 expression levels in the mesenchymal subclusters. h, Heatmap showing gene expression levels in the mesenchymal subclusters. Yellow dashed lines delineate the injured area; yellow arrowheads point to αSMA+ cells. Scale bars, 100 μm. Source data
Extended Data Fig. 3
Extended Data Fig. 3. Endocardial area coverage is not affected in cryoinjured myd88−/− ventricles.
a, Representative images of immunostaining for EGFP (endocardial cells, green) and Aldh1a2 (endocardial and epicardial cell activation marker, magenta) with DAPI (DNA marker, blue) counterstaining on sections of cryoinjured ET(krt4:EGFP); myd88+/+ and ET(krt4:EGFP); myd88−/− ventricles at 96 hpci. b, Ratio of krt4:EGFP+ cell area within the injured tissue in cryoinjured myd88+/+ and myd88−/− ventricles at 96 hpci. The dots in the graph represent individual ventricles; data are shown as the mean ± s.d.; n = 7 myd88+/+ and n = 6 myd88−/−. Statistical test: Student’s t-test. c, Representative images of immunostaining for Cdh5 (endothelial cell marker, white) on 50-μm-thick sections of cryoinjured myd88+/+ and myd88−/− ventricles at 7 dpci. d, Ratio of Cdh5+ cell area within the injured tissue in cryoinjured myd88+/+ and myd88−/− ventricles at 7 dpci. The dots in the graph represent individual ventricles; data are shown as the mean ± s.d.; n = 7 myd88+/+ and n = 4 myd88−/−. Statistical test: Mann-Whitney U-test. Yellow dashed lines delineate the injured area. Scale bars, 100 μm. Source data
Extended Data Fig. 4
Extended Data Fig. 4. Bigger scars at 30 but not at 90 dpci in cryoinjured myd88−/− ventricles.
a, Graph showing the percentage of the collagen/scar area at 14 and 30 dpci. The dots in the graph represent individual ventricles, and data are shown as the mean ± s.d.; n = 6 myd88+/+ and n = 6 myd88−/−. Statistical tests: Student’s t-test. b, Graph showing representation of groups (y axis) of different scar area sizes (different colors) at 30 dpci in cryoinjured myd88+/+ and myd88−/− ventricles. c, Representative images of AFOG staining on sections of cryoinjured myd88+/+ and myd88−/− ventricles at 90 dpci. d, Graph showing representation of groups (y axis) of different scar area sizes (different colors) at 90 dpci in cryoinjured myd88+/+ and myd88−/− ventricles. Black dashed lines delineate the scar area. Scale bars, 200 μm. Source data
Extended Data Fig. 5
Extended Data Fig. 5. Enrichment analysis terms affected in the cryoinjured myd88−/− endocardium at 96 hpci.
a, Selected GSEA plots for GO and KEGG pathway terms from transcriptomic analysis in the cryoinjured myd88−/− versus myd88+/+ endocardium at 96 hpci. Plots with red and blue lines indicate processes enriched in myd88 (mutant; myd88−/−) and WT (myd88+/+), respectively. b, Plot showing Reactome pathway terms enriched in the cryoinjured myd88+/+ (WT) versus myd88−/− (myd88 mutant) endocardium at 96 hpci. Source data
Extended Data Fig. 6
Extended Data Fig. 6. pERK+ area coverage is not significantly affected in cryoinjured myd88−/− ventricles.
a, Representative images of immunostaining for EGFP (endocardial cells, green) and pERK (activated MAPK signaling pathway, magenta) with DAPI (DNA marker, blue) counterstaining on sections of cryoinjured ET(krt4:EGFP); myd88+/+ and ET(krt4:EGFP); myd88−/− ventricles at 96 hpci. b, Ratio of pERK+ cell area within the injured tissue in cryoinjured myd88+/+ and myd88−/− ventricles at 96 hpci. The dots in the graph represent individual ventricles; data are shown as the mean ± s.d.; n = 7 myd88+/+ and n = 5 myd88−/−. Statistical test: Student’s t-test. Yellow dashed lines delineate the injured area. Scale bars, 100 μm. Source data
Extended Data Fig. 7
Extended Data Fig. 7. Revascularization phenotype in cryoinjured myd88−/− ventricles.
a, c, Representative images of immunostaining for RFP (coronary endothelial cells, green) and PCNA (proliferation marker, magenta) with DAPI (DNA marker, blue) counterstaining on sections of cryoinjured Tg(-0.8flt1:RFP); myd88+/+ and Tg(-0.8flt1:RFP); myd88−/− ventricles at 96 hpci (a) and 7 dpci (c). b, d, Percentage of proliferating coronary endothelial cells in the injured tissues and border zone areas (200 μm) at 96 hpci (b) and 7 dpci (d). The dots in the graphs represent individual ventricles; data are shown as the mean ± s.d.; n = 7 myd88+/+, n = 6 myd88−/− at 96 hpci (b), and n = 4 myd88+/+, n = 5 myd88−/− at 7 dpci (d). Statistical tests: Student’s t-test. e, Wholemount images of cryoinjured Tg(-0.8flt1:RFP); myd88+/+ and Tg(-0.8flt1:RFP); myd88−/− ventricles at 7 dpci. f, Percentage of coronary vessel coverage in the injured tissues of cryoinjured Tg(-0.8flt1:RFP); myd88+/+ and Tg(-0.8flt1:RFP); myd88−/− ventricles at 7 dpci. The dots in the graphs represent individual ventricles; data are shown as the mean ± s.d.; n = 4 myd88+/+ and n = 6 myd88−/−. Statistical test: Student’s t-test. Yellow dashed lines delineate the injured area; yellow arrowheads point to proliferating coronary endothelial cells. Scale bars, 100 μm (a,c), 200 μm (e). Source data
Extended Data Fig. 8
Extended Data Fig. 8. CM dedifferentiation at 96 hpci and proliferation at 14 dpci are not significantly affected in cryoinjured myd88−/− ventricles.
a, Representative images of immunostaining for MEF2 (CM nuclei, green) and N2.261 (dedifferentiation marker, magenta) on sections of cryoinjured myd88+/+ and myd88−/− ventricles at 96 hpci. b, Quantification of the number of dedifferentiating CMs in border zone areas (100 μm) at 96 hpci. The dots in the graphs represent individual ventricles; data are shown as the mean ± s.d.; n = 5 myd88+/+ and n = 5 myd88−/−. Statistical test: Student’s t-test. c, Representative images of immunostaining for MEF2 (CM nuclei, green) and PCNA (proliferation marker, magenta) on sections of cryoinjured myd88+/+ and myd88−/− ventricles at 14 dpci. d, Quantification of proliferating CMs in border zone areas (100 μm) at 14 dpci. The dots in the graphs represent individual ventricles; data are shown as the mean ± s.d.; n = 5 myd88+/+ and n = 4 myd88−/−. Statistical test: Student’s t-test. Yellow dashed lines delineate the injured area; yellow arrowheads point to dedifferentiating (a) and proliferating (c) CMs. Scale bars, 100 μm. Source data
Extended Data Fig. 9
Extended Data Fig. 9. Validation of the Tg(fli1a:myd88,EGFP) line.
a, RT-qPCR analysis of myd88 mRNA levels in transgenic (Tg(fli1a:myd88,EGFP)) and non-transgenic 24 hpf larvae and 96 hpci ventricles. Data are shown as the mean ± s.d.; n = 3 (no transgene) and n = 3 (Tg(fli1a:myd88,EGFP)) 24 hpf larvae and n = 6 (no transgene) and n = 6 (Tg(fli1a:myd88,EGFP)) 96 hpci ventricles. Statistical tests: Student’s t-test. Ct values listed in Supplementary Table 3. b, Representative images of immunostaining for EGFP (endothelial cells, green) and Aldh1a2 (endocardial and epicardial cell activation marker, magenta) with DAPI (DNA marker, blue) counterstaining on a section of a cryoinjured Tg(fli1a:myd88,EGFP); myd88+/+ ventricle at 96 hpci. Yellow dashed lines delineate the injured area. Scale bars, 100 μm. Source data
Extended Data Fig. 10
Extended Data Fig. 10. Validation of cxcl18b tools.
a, Representative images of immunostaining for EGFP (cxcl18b expression, white) with DAPI (DNA marker, blue) counterstaining on a section of a cryoinjured Tg(cxcl18b:EGFP) ventricle at 24 hpci; n = 1. b, Experimental plan for Cre mRNA injected and uninjected (control) Tg(hsp70l:LBL-cxcl18b-t2a-mCherry) sibling larvae. c, RT-qPCR analysis of cxcl18b and mCherry mRNA levels in Cre mRNA-injected and uninjected (control) Tg(hsp70l:LBL-cxcl18b-t2a-mCherry) larvae. The dots in the graph represent individual larvae; data are shown as the mean ± s.d.; n = 4 (Control) and n = 4 (Cre mRNA injected). Statistical tests: Student’s t-test. Ct values listed in Supplementary Table 3. d, Representative images of immunostaining for mCherry (cxcl18b overexpressing cells, white) on sections of cryoinjured ventricles from uninjected (control) myd88+/−, Cre mRNA injected (cxcl18b OE) myd88+/−, uninjected (control) myd88−/− and Cre mRNA injected (cxcl18b OE) myd88−/− siblings at 24 hpci; all zebrafish carry the hsp70l:LBL-cxcl18b-t2a-mCherry transgene; n = 6 (myd88+/− control), n = 5 (myd88+/− cxcl18b OE), n = 6 (myd88−/− control), and n = 5 (myd88−/− cxcl18b OE). Experimental plan in Fig. 6d. e, Genomic sequence of the cxcl18bbns683 full locus deletion allele. f, Experimental plan and RT-qPCR analysis of cxcl18b mRNA levels in cxcl18b+/+ and cxcl18b−/− larvae 6 hours post fin fold amputation (hpa). The dots in the graph represent individual larvae; data are shown as the mean ± s.d.; n = 4 cxcl18b+/+ and n = 3 cxcl18b−/−. Statistical test: Student’s t-test. Ct values listed in Supplementary Table 3. Yellow dashed lines delineate the injured area. Scale bars, 100 μm. Source data

Similar articles

Cited by

References

    1. Braunwald, E. The war against heart failure: the Lancet lecture. Lancet385, 812–824 (2015). 10.1016/S0140-6736(14)61889-4 - DOI - PubMed
    1. Talman, V. & Ruskoaho, H. Cardiac fibrosis in myocardial infarction—from repair and remodeling to regeneration. Cell Tissue Res.365, 563–581 (2016). 10.1007/s00441-016-2431-9 - DOI - PMC - PubMed
    1. González-Rosa, J. M., Martín, V., Peralta, M., Torres, M. & Mercader, N. Extensive scar formation and regression during heart regeneration after cryoinjury in zebrafish. Development138, 1663–1674 (2011). 10.1242/dev.060897 - DOI - PubMed
    1. Schnabel, K., Wu, C.-C., Kurth, T. & Weidinger, G. Regeneration of cryoinjury induced necrotic heart lesions in zebrafish is associated with epicardial activation and cardiomyocyte proliferation. PLoS ONE6, e18503 (2011). 10.1371/journal.pone.0018503 - DOI - PMC - PubMed
    1. Chablais, F., Veit, J., Rainer, G. & Jaźwińska, A. The zebrafish heart regenerates after cryoinjury-induced myocardial infarction. BMC Dev. Biol.11, 21 (2011). 10.1186/1471-213X-11-21 - DOI - PMC - PubMed

MeSH terms

Substances