. 2024 Sep 13;14(1):21417.
doi: 10.1038/s41598-024-72306-1.

Tumour immune characterisation of primary triple-negative breast cancer using automated image quantification of immunohistochemistry-stained immune cells

Affiliations

Tumour immune characterisation of primary triple-negative breast cancer using automated image quantification of immunohistochemistry-stained immune cells

Suze Roostee et al. Sci Rep. .

Abstract

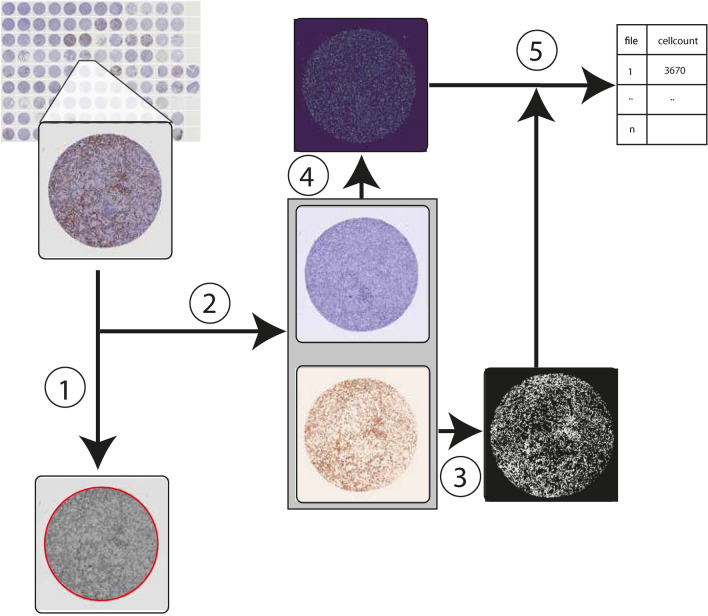
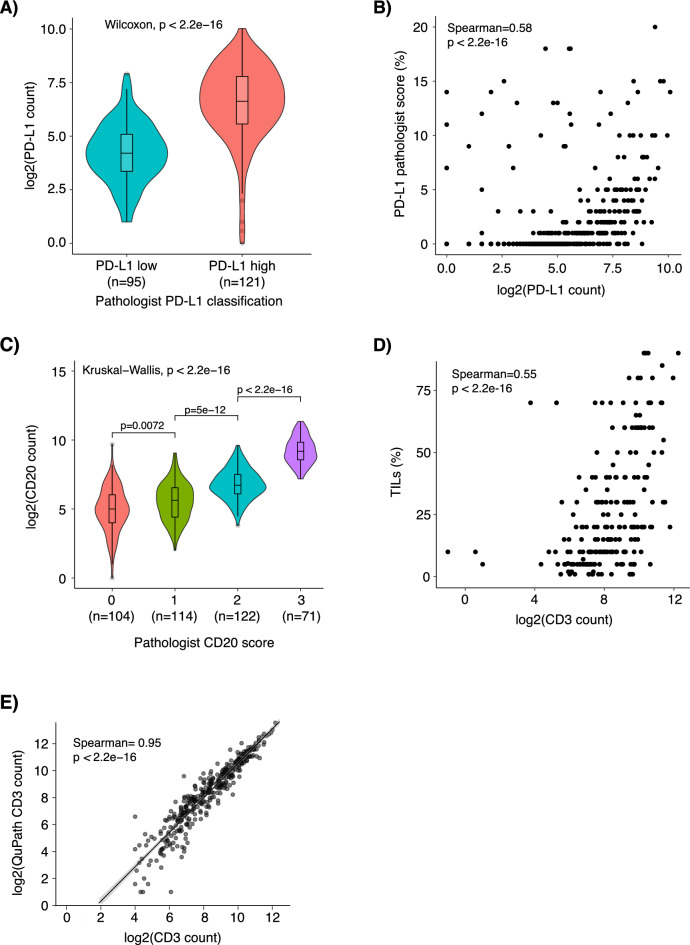
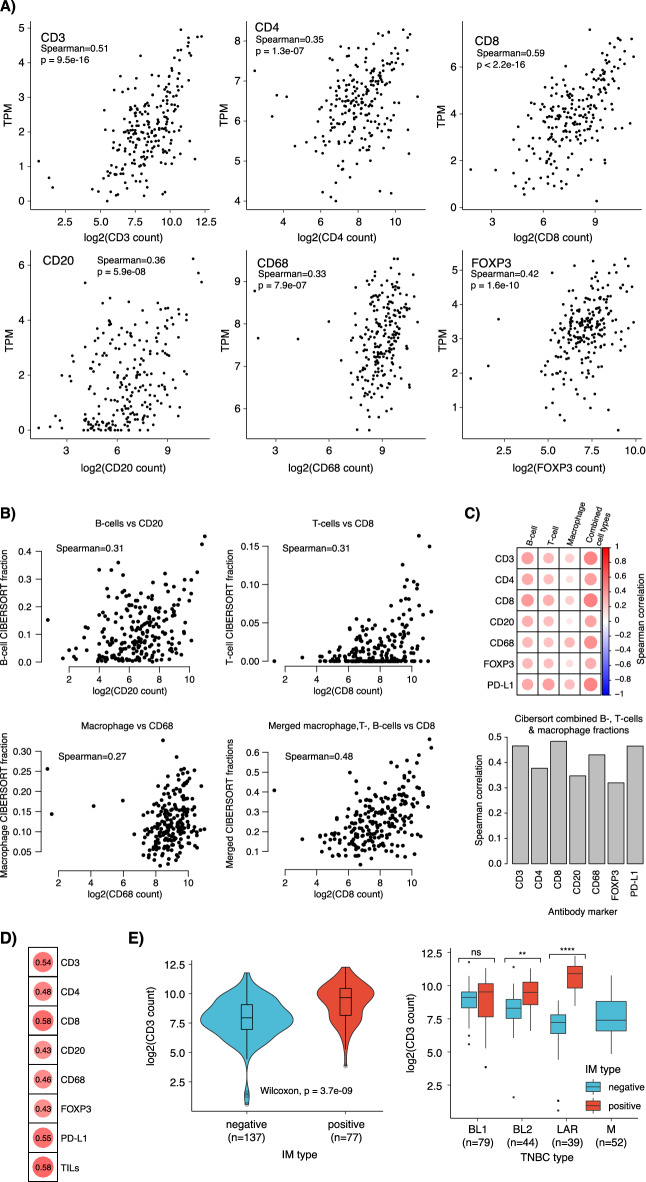
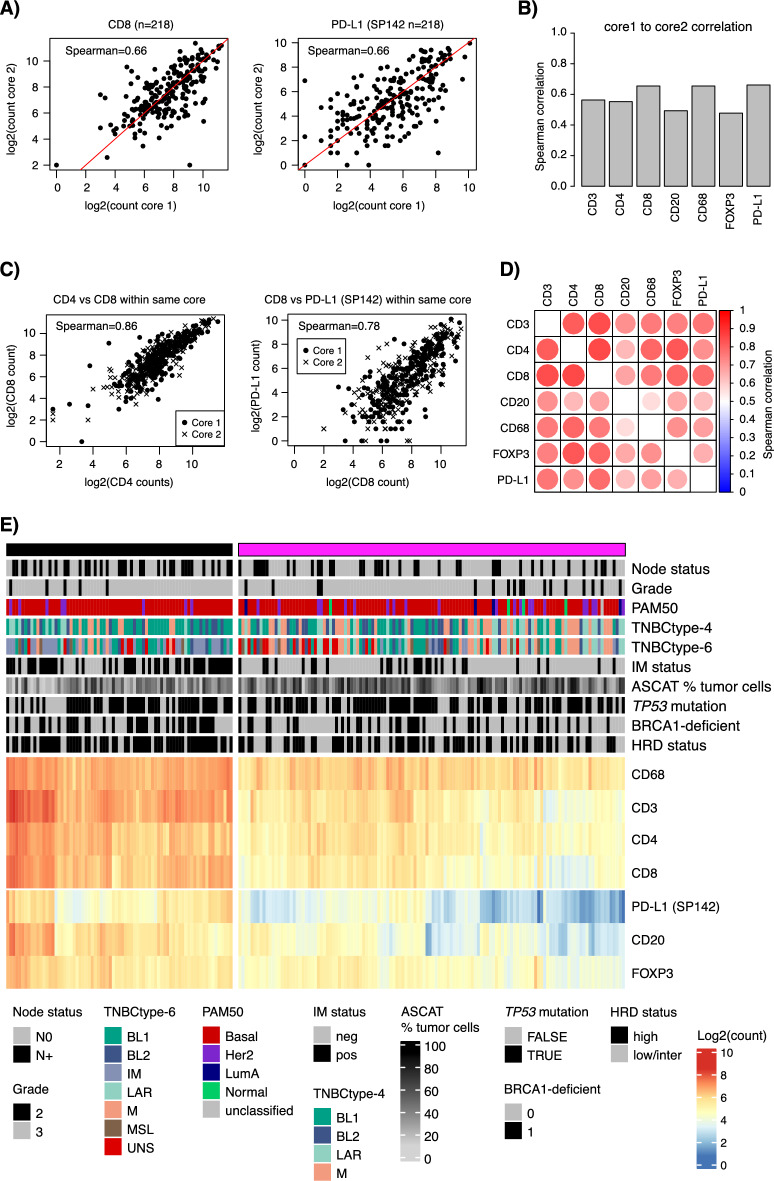
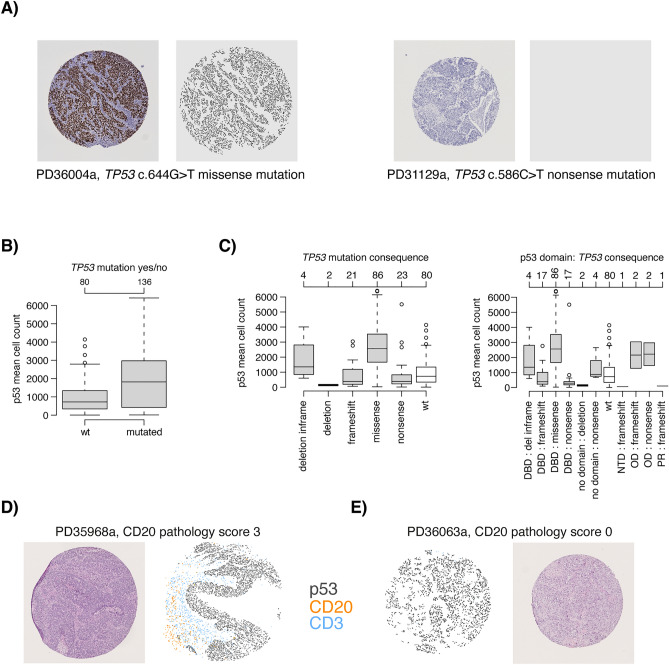
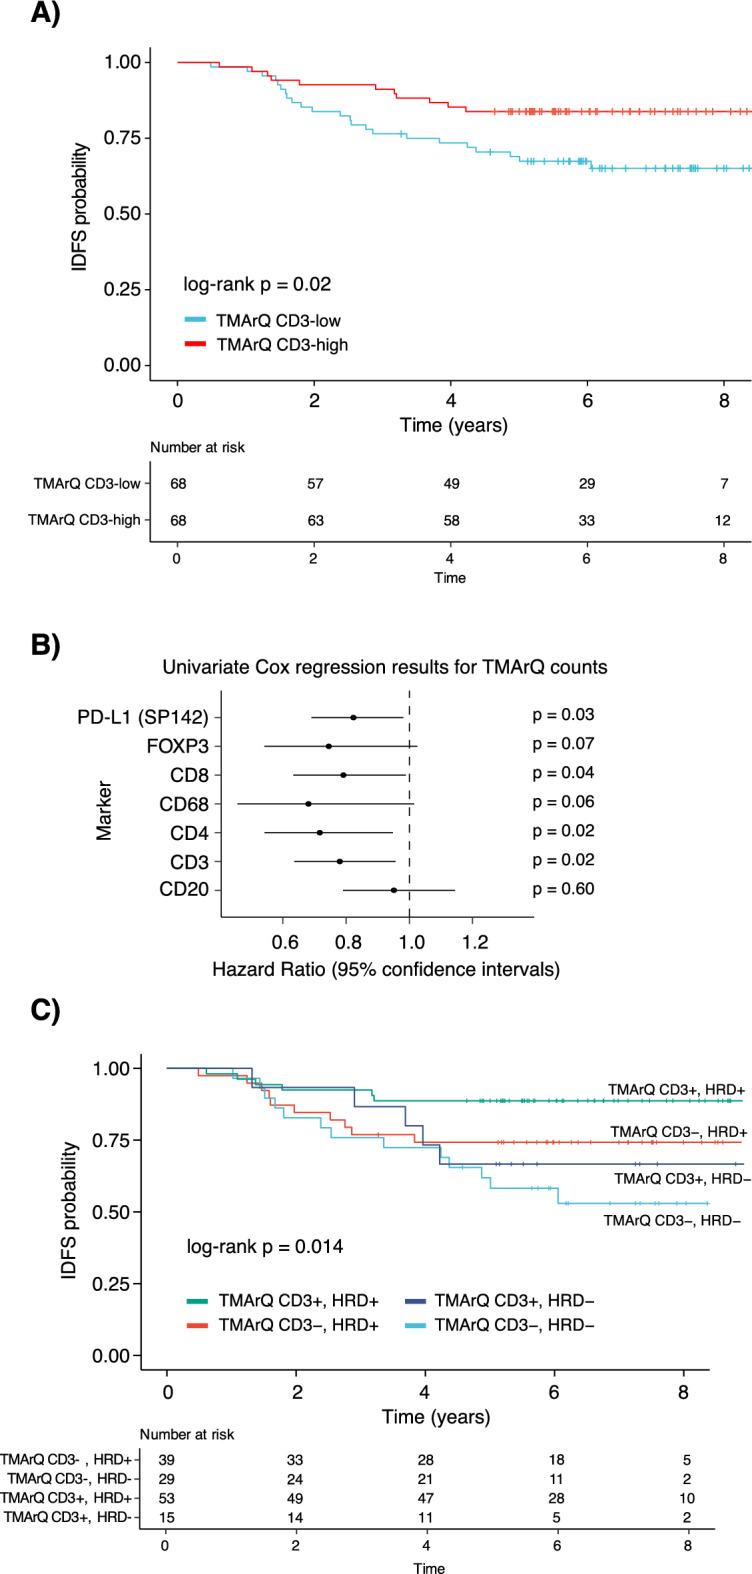
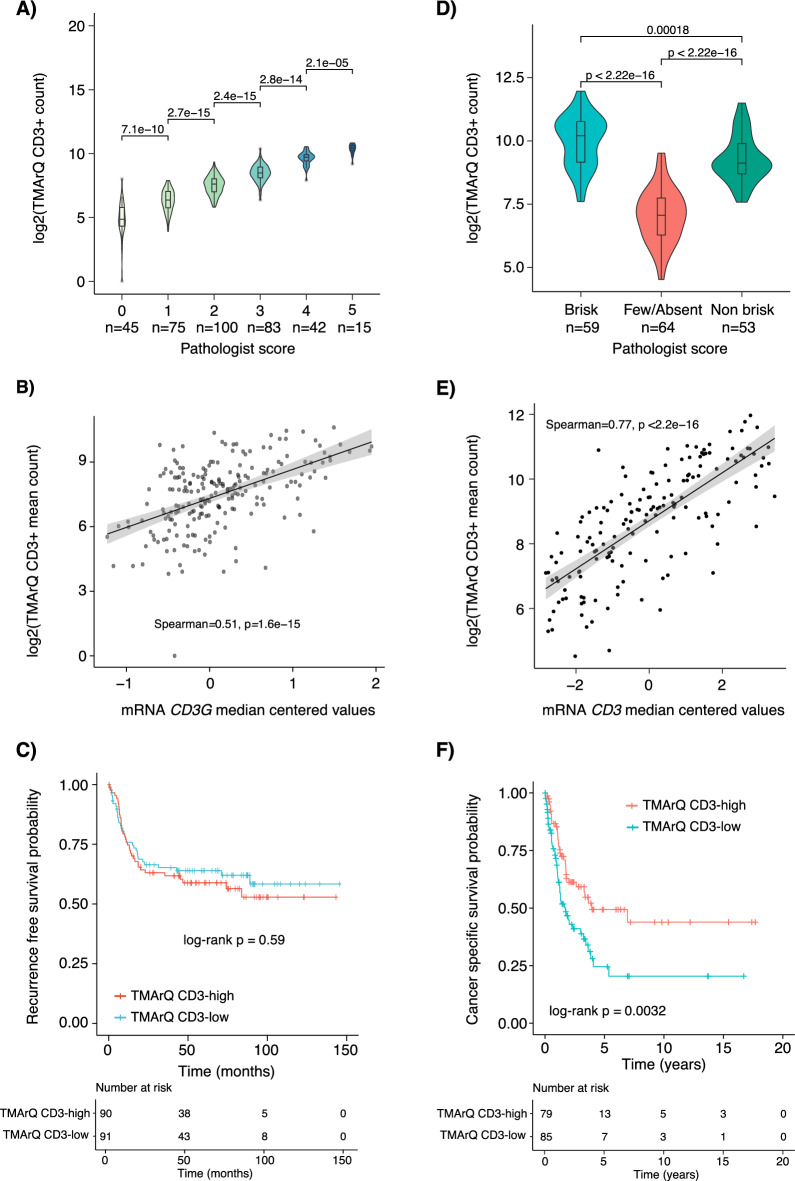
The tumour immune microenvironment (TIME) in breast cancer is acknowledged with an increasing role in treatment response and prognosis. With a growing number of immune markers analysed, digital image analysis may facilitate broader TIME understanding, even in single-plex IHC data. To facilitate analyses of the latter an open-source image analysis pipeline, Tissue microarray MArker Quantification (TMArQ), was developed and applied to single-plex stainings for p53, CD3, CD4, CD8, CD20, CD68, FOXP3, and PD-L1 (SP142 antibody) in a 218-patient triple negative breast cancer (TNBC) cohort with complementary pathology scorings, clinicopathological, whole genome sequencing, and RNA-sequencing data. TMArQ's cell counts for analysed immune markers were on par with results from alternative methods and consistent with both estimates from human pathology review, different quantifications and classifications derived from RNA-sequencing as well as known prognostic patterns of immune response in TNBC. The digital cell counts demonstrated how immune markers are coexpressed in the TIME when considering TNBC molecular subtypes and DNA repair deficiency, and how combination of immune status with DNA repair deficiency status can improve the prognostic stratification in chemotherapy treated patients. These results underscore the value and potential of integrating TIME and specific tumour intrinsic alterations/phenotypes for the molecular understanding of TNBC.


Conflict of interest statement

The authors declare no competing interests.

Figures

Fig. 1
Fig. 1
TMArQ Image analysis pipeline workflow. Outline of the TMArQ analysis approach based on the starDist cell segmentation algorithm. (1) Detection of region of interest (ROI) using Hough circle detection (red circle). (2) Colour deconvolution to separate out the DAB staining from the hematoxylin staining. (3) Thresholding signal in the DAB layer to determine DAB absence/presence on the level of individual pixels. (4) Cell nuclei segmentation using starDist. (5) Combining starDist detected cells with the DAB staining layer to count IHC-stained cells in the core.
Fig. 2
Fig. 2
Comparison of TMArQ cell counts to pathologist scoring and QuPath scores in TNBC. (A) Violin plots showing the distribution of TMArQ cell counts of PD-L1 (SP142) to pathologist scores of PD-L1 low (< 1% IC) or PD-L1 high (≥ 1% IC). (B) Scatterplot showing the correlation of PD-L1 pipeline counts for each core to corresponding pathology estimated SP142 PD-L1 scores in %. (C) Violin plots showing the distribution of CD20 pipeline counts to binned pathologist CD20 scores. (D) Scatterplot showing the correlation of CD3 pipeline counts from TMA cores to pathology TIL percentages estimated from matched H&E-stained whole slide sections. (E) Scatterplot showing the comparison of TMArQ core CD3 counts to QuPath CD3 core counts. Log transformation of TMArQ counts was performed before analyses.
Fig. 3
Fig. 3
Correlation of TMArQ cell counts to RNA-sequencing data in TNBC. (A) Scatterplots of matched RNA-sequencing TPM-values compared to TMArQ cell counts. mRNA expression for CD3 was based on the CD3G gene, for CD8 on the CD8A gene, for CD20 on the MS4A1 gene. (B) CIBERSORT immune cell proportions compared to matched cell type specific TMArQ cell counts for CD20 (B-cell marker), CD8 (T-cell marker), and CD68 (macrophage marker). In addition, a scatter plot of the summarized CIBERSORT fraction of B-cells, T-cells, and macrophages versus CD8 cell counts are shown. (C) Top panel shows a Spearman correlation heatmap of analysed IHC markers versus individual CIBERSORT immune types, as well as the summarized fraction of the latter. Bottom panel shows the specific Spearman correlations of the analysed IHC markers versus the summarized CIBERSORT immune faction. (D) Spearman correlation of rank scores for a gene expression immune metagene versus TMArQ mean cell counts (mean counts of both cores/sample). (E) TMArQ CD3 cell counts versus the Lehmann IM subgroup definition (left) and the Lehmann mRNA subtypes (TNBCtype-4) stratified by IM status (right). Pair-wise p-values were computed using Wilcoxon’s test. Log transformation of TMArQ counts was performed before analyses.
Fig. 4
Fig. 4
Comparison of TMA core-to-core, marker-to-marker, and marker co-expression patterns for immune markers in TNBC. (A) Core-to-core variability for TMArQ cell counts across 218 cases in the TMA for CD8 (left), and PD-L1 (SP142 antibody) (right). (B) Summarized Spearman core-to-core correlations for cell counts across all samples and markers. (C) Marker-to-marker correlation within cores (stacks of single-plex stains) for TMArQ cell counts from CD4 vs CD8 (left) and CD8 vs PD-L1 (SP142 antibody) (right) for all cases and cores. Spearman correlation is calculated on the merged set of data from both cores. (D) Spearman correlation heatmap of all marker-to-marker correlations within cores. Correlation is calculated based on the merged set of data from both cores. (E) Clustered co-expression matrix of average TMArQ cell counts (mean of cores/sample) for all markers and samples. Clustering was performed using Euclidian distance and complete linkage and samples were divided into two main clusters. Sample annotation track include tumour status by tumour grade, lymph node status (N0/N +), PAM50 molecular subtypes, proposed TNBC gene expression subtypes (TNBCtype-4 and TNBCtype-6), mRNA derived immunomodulatory subtype (IM) status, and WGS determined tumour cell content percentage by ASCAT, TP53 mutation status, BRCA1-deficiency status (mutation or promoter hypermethylation inactivation), and HRD-status. Log transformation of TMArQ counts was performed before analyses.
Fig. 5
Fig. 5
In silico merged composite images of single-plex IHC stains and application to p53 expression. (A) Left panel shows high p53 protein expression in a TMA core for tumour PD36004a with an c.644G > T missense TP53 mutation. Right panel shows the low p53 protein staining in a TMA core for tumour PD31129a with a c.586C > T nonsense TP53 mutation. (B) TMArQ cell counts for p53 versus WGS TP53 mutation status (wild type/mutated). (C) Left panel shows cell counts for p53 versus TP53 mutation consequence. Right panel shows the p53 cell counts for the combination of mutation consequence and p53 protein domain (obtained from). In both panels, the TP53 wildtype (wt) group is shown in white for reference. In panels B and C, the average p53 counts of both TMA cores are shown. DBD: DNA binding domain, NTD: N-terminal transactivation domain, OD: oligomerization domain, PR: proline-rich domain. (D) In silico merged composite stains for CD20, CD3, and p53 for tumour PD35968a. This tumour is HRD-positive by WGS and has a CD20 pathology score of 3 + (highest score). Cell objects for each marker are assigned a specific colour as indicated in the legend. E) In silico merged composite stains for CD3, CD20, and p53 for tumour PD36063a which is HRD-positive by WGS and has a CD20 pathology score of 0 (lowest score).
Fig. 6
Fig. 6
Association of TMArQ cell counts with patient outcome after adjuvant chemotherapy in TNBC. (A) Kaplan–Meier plot of IDFS as clinical endpoint for log2-transformed TMArQ CD3 cell counts (mean value of both cores) stratified into two groups (low/high) based on the median cell count in TNBC patients treated with adjuvant chemotherapy. The p-value was calculated using the log-rank test. (B) Forest plot illustrating hazard ratios with 95% confidence intervals from univariate Cox regression analysis of log2-transformed TMArQ cell counts as continuous values for each immune marker. Each tumour was represented by its average cell count of the two cores. (C) Kaplan–Meier plot of IDFS as clinical endpoint for patients treated with adjuvant chemotherapy stratified by TMArQ CD3-low/high and WGS-based HRD-status (positive/negative). The p-value was calculated using the log-rank test.
Fig. 7
Fig. 7
Application of TMArQ to single-plex CD3 IHC data from bladder cancer and malignant melanoma. (A) TMArQ CD3 counts versus human grading of CD3 expression into five bins in TMA data (n = 360 cores) from 289 bladder cancers. (B) TMArQ CD3 mean counts for 211 patients with matched CD3 (CD3G) mRNA expression levels. (C) Kaplan–Meier plot of bladder cancer patients without adjuvant chemotherapy stratified by their median TMArQ CD3 counts (average core score per patient) into high and low groups using recurrence free survival as endpoint. P-value calculated using the log-rank test. (D) TMArQ CD3 mean counts versus Brisk pathology grades in 176 cores. (E) TMArQ CD3 mean counts versus matched CD3 mRNA expression levels in the malignant melanoma cohort for tumours with available mRNA data. (F) Kaplan–Meier plot of malignant melanoma patients stratified by their median TMArQ CD3 counts into high and low groups using cancer specific survival as endpoint. The stratification was based on the median of the average CD3 count per patient (i.e. the average count across cores per patient) using the entire cohort of patients. P-value calculated using the log-rank test. Log transformation of TMArQ counts was performed before analyses.

References

    1. Sung, H. et al. Global cancer statistics 2020: GLOBOCAN estimates of incidence and mortality worldwide for 36 cancers in 185 countries. CA Cancer J. Clin.71, 209–249. 10.3322/caac.21660 (2021). 10.3322/caac.21660 - DOI - PubMed
    1. Foulkes, W. D., Smith, I. E. & Reis-Filho, J. S. Triple-negative breast cancer. N. Engl. J. Med.363, 1938–1948. 10.1056/NEJMra1001389 (2010). 10.1056/NEJMra1001389 - DOI - PubMed
    1. Staaf, J. et al. Whole-genome sequencing of triple-negative breast cancers in a population-based clinical study. Nat. Med.25, 1526–1533. 10.1038/s41591-019-0582-4 (2019). 10.1038/s41591-019-0582-4 - DOI - PMC - PubMed
    1. Davies, H. et al. HRDetect is a predictor of BRCA1 and BRCA2 deficiency based on mutational signatures. Nat. Med.23, 517–525. 10.1038/nm.4292 (2017). 10.1038/nm.4292 - DOI - PMC - PubMed
    1. de Jong, V. M. T. et al. Prognostic value of stromal tumor-infiltrating lymphocytes in young, node-negative, triple-negative breast cancer patients who did not receive (neo)adjuvant systemic therapy. J. Clin. Oncol.40, 2361–2374. 10.1200/JCO.21.01536 (2022). 10.1200/JCO.21.01536 - DOI - PMC - PubMed

MeSH terms

Substances

LinkOut - more resources