. 2024 Nov;16(11):1794-1802.
doi: 10.1038/s41557-024-01630-w. Epub 2024 Sep 13.

Small-molecule properties define partitioning into biomolecular condensates

Affiliations

Small-molecule properties define partitioning into biomolecular condensates

Sabareesan Ambadi Thody et al. Nat Chem. 2024 Nov.

Abstract

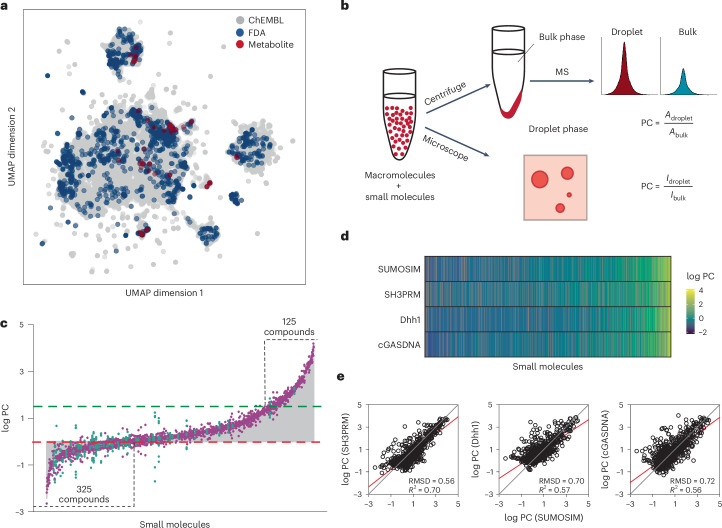
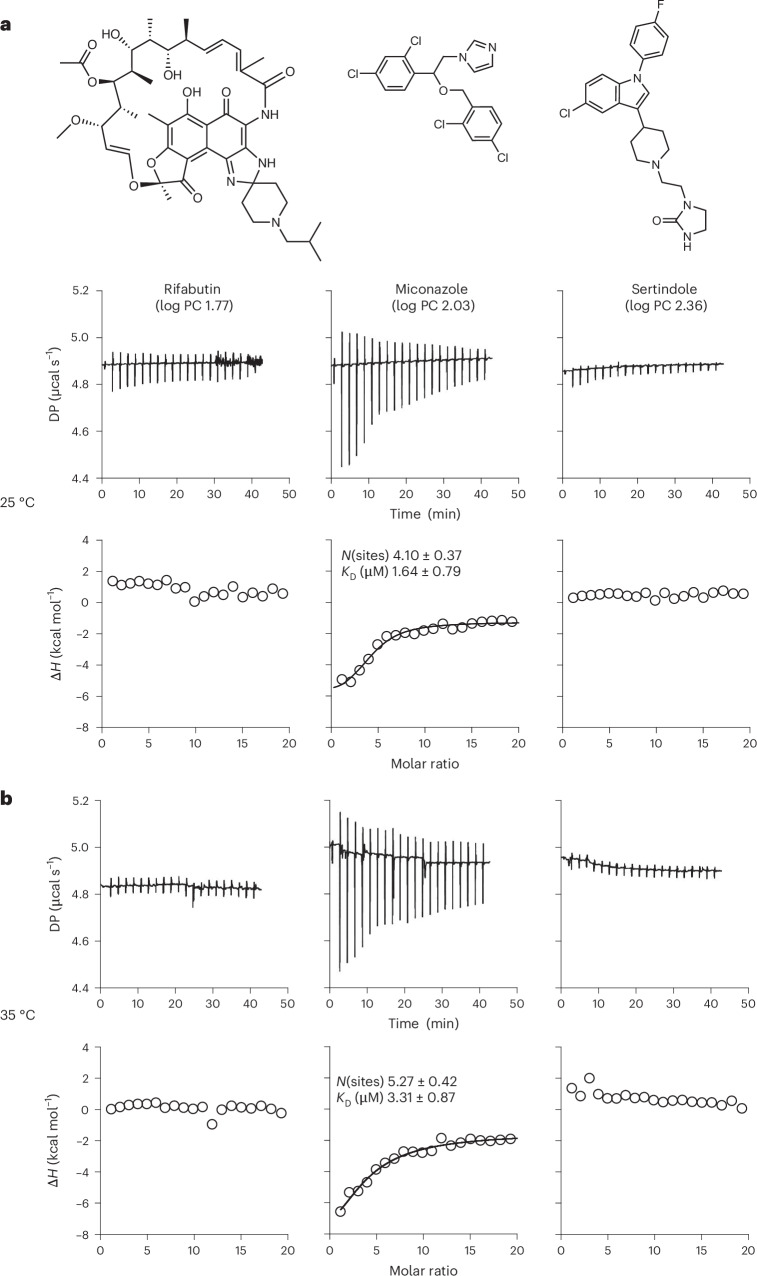
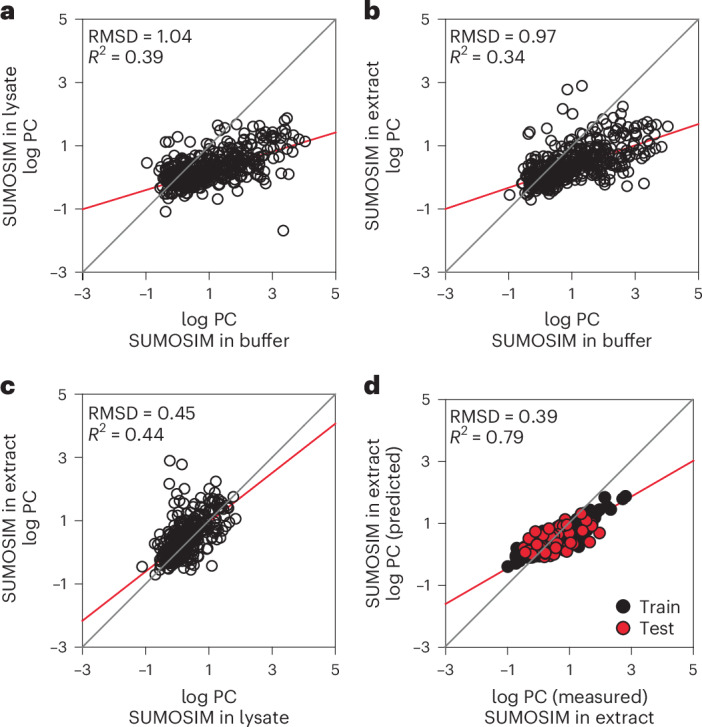
Biomolecular condensates regulate cellular function by compartmentalizing molecules without a surrounding membrane. Condensate function arises from the specific exclusion or enrichment of molecules. Thus, understanding condensate composition is critical to characterizing condensate function. Whereas principles defining macromolecular composition have been described, understanding of small-molecule composition remains limited. Here we quantified the partitioning of ~1,700 biologically relevant small molecules into condensates composed of different macromolecules. Partitioning varied nearly a million-fold across compounds but was correlated among condensates, indicating that disparate condensates are physically similar. For one system, the enriched compounds did not generally bind macromolecules with high affinity under conditions where condensates do not form, suggesting that partitioning is not governed by site-specific interactions. Correspondingly, a machine learning model accurately predicts partitioning using only computed physicochemical features of the compounds, chiefly those related to solubility and hydrophobicity. These results suggest that a hydrophobic environment emerges upon condensate formation, driving the enrichment and exclusion of small molecules.


Conflict of interest statement

The authors declare no competing interests.

Figures

Fig. 1
Fig. 1. Partitioning of chemical compounds varies over nearly six orders of magnitude and is correlated between condensates.
a, UMAP representation of ~1,700 small molecules used in the analysis that is based on physical features generated in QikProp. b, Schematic illustrating the assays used to measure small-molecule partitioning into condensates on the basis of mass spectrometry (MS; top) and confocal fluorescence microscopy (bottom). In b, Adroplet and Abulk are the area under the curve for droplet and bulk fractions measured using MS, respectively. Similarly, Idroplet and Ibulk are the fluorescence intensity from droplets and bulk solution measured using confocal fluorescence microscopy, respectively. c, Bar chart of PC values, ordered from smallest to largest, for the partitioning of 1,037 compounds into the SUMOSIM condensate. Red and green dashed lines indicate log PC = 0 and log PCSUMOSIM (1.77), respectively. The numbers of compounds with log PC < 0 and log PC > log PCSUMOSIM are indicated. In c, the grey-coloured areas represent the bar plots for the mean values of the data, and green and purple dots represent metabolites and drug compounds, respectively. d, Heat map showing the log PC values for each of the four condensates indicated. Columns are organized in ascending order according to the average PC value across the four condensates. e, Scatter plots of log PC values for compounds into the SUMOSIM condensate versus into the SH3PRM, Dhh1 and cGASDNA condensates. Red and grey lines show linear fit of the data and diagonal, respectively. Source data
Fig. 2
Fig. 2. Many compounds do not bind SUMOSIM scaffolds under non-phase-separating conditions.
a,b, Raw ITC thermograms (top row) and integrated enthalpies (bottom row) for titrations of rifabutin (left), miconazole (middle) and sertindole (right) into 20 µM module concentrations of polySUMO + polySIM (below the phase separation threshold) at 25 °C (a) and 35 °C (b). DP, differential power. Source data
Fig. 3
Fig. 3. Machine learning models for the partitioning of small molecules into biomolecular condensates are predictive and indicate that physical features determine the partitioning behaviour.
A 100-fold re-randomization of train–test sets was used to compute the indicated confidence intervals. a, XGBoost model of small-molecule partitioning into SUMOSIM condensates (Ntrain = 590 (black), Ntest = 194 (blue), R2train = 0.89 ± 0.01, MAEtrain = 0.21 ± 0.01, R2test = 0.56 ± 0.03, MAEtest = 0.48 ± 0.01). b, Validation set predictions for the SUMOSIM model (Ntrain = 784 (not shown), Nvalidation = 204 (red), R2validation = 0.44 ± 0.05, MAEvalidation = 0.44 ± 0.03). c, SHAP feature importance analysis showing the relative feature importance of the top SUMOSIM XGBoost model. QPlogPo/w, predicted octanol/water partition coefficient; QPlogS, predicted aqueous solubility; CIQPlogS, conformation-independent predicted aqueous solubility; QPlogKhsa, prediction of binding to human serum albumin; QPPMDCK, predicted apparent MDCK cell permeability; FISA, hydrophilic component of the solvent-accessible surface area; FOSA, hydrophobic component of the solvent-accessible surface area; Jm, predicted maximum transdermal transport rate; WPSA, weakly polar component of the solvent-accessible surface area; QPpolrz, predicted polarizability in cubic ångströms; #acid, number of carboxylic acid groups; QPlogPC16, predicted hexadecane/gas partition coefficient; mol MW, molecular weight of the molecule; PISA, π (carbon and attached hydrogen) component of the solvent-accessible surface area; Tot Q, total charge; QPlogBB, predicted brain/blood partition coefficient; IP(eV), PM3-calculated ionization potential; EA(eV), PM3-calculated electron affinity; RuleOfFive, number of violations of Lipinski’s rule of five; QPlogHERG, predicted IC50 value for blockage of HERG K+ channels. d, SHAP decomposition showing that the impact of features on each model prediction shows nonlinearity between small-molecule feature values and the measured partitioning behaviour. Source data
Fig. 4
Fig. 4. Compounds show different distributions of PC values under different solvent conditions.
a,b, Scatter plots of log PC values of compounds in SUMOSIM condensates generated in a U2OS cell lysate (a) or a Xenopus oocyte extract (b) versus in buffer. c, Scatter plot of log PC values of compounds in SUMOSIM condensates generated in the Xenopus oocyte extract versus in the U2OS cell lysate. d, Machine learning model of compound partitioning in the Xenopus oocyte extract. Red and grey lines show linear fit of the data and diagonal, respectively. Source data
Extended Data Fig. 1
Extended Data Fig. 1. Chemical space map of all the compounds used in this study.
a. Color-coded static chemical space map of all the compounds used in this study. UMAP dimensions 1 and 2 are abstract coordinates that combine QikProp features to visualize the relationships among the compounds. An interactive chemical space map of all compounds used in this study can be accessed using Supplementary Data 1 (Interactive HTML file). Hovering over data points shows the corresponding name and structure; molecules are colored according to their cluster. b. Definitions of QikProp feature names used throughout text. Source data
Extended Data Fig. 2
Extended Data Fig. 2. Compound libraries do not appreciably affect scaffold protein partitioning or condensate dynamics.
A-I. Quantification of the amount of scaffold protein in the condensate and bulk phases in the absence and presence of different compound libraries using an SDS-PAGE method. The figures (A) for cGAS-DNA, (C) for SUMOSIM, (E) for SH3-PRM, and (G) for Dhh1 show example raw gel images of proteins in condensate and bulk fractions in the presence of DMSO control or one of five ~300-compound sublibraries of FDA approved drugs. The corresponding relative (to control) quantification of scaffold protein in the condensate fractions is displayed in (B) for cGAS-DNA, (D) for SUMOSIM, (F) for SH3-PRM, and (H) for Dhh1. Data distribution shown for two independent experiments. The data show that within experimental error the amounts of scaffold in both the condensate and bulk phases did not change with addition of drugs. It remains formally possible that droplet volumes and partition coefficients are changing in concert (inversely, such that total material is unchanged), but it is unlikely that this would be the case in all four condensates with all 5 chemical sub libraries. We also note anecdotally we did not observe obvious differences in droplet size or morphology between the DMSO controls and drug library experiments. Thus, the simplest interpretation for the data is that the compounds do not affect the condensate volume or partition coefficients of the scaffolds. I. Fluorescence Recovery After Photobleaching (FRAP) of all four condensates in the absence (DMSO) and presence of two drug sublibraries (Dark-Library #1 and Dark-Library #2, derived from standard sublibraries #1 and #2 by removing fluorescent compounds). The data provided in Supplementary Fig. 1. The time of recovery and the percentage of recovery for each condensate system under different conditions are presented in the table below the figure. Errors are the standard deviation calculated from at least 3 independent measurements. Source data
Extended Data Fig. 3
Extended Data Fig. 3. Most compounds have similar PC values when measured in large or smaller groups.
(a) Scatter plot of logPC values measured for a library of 240 compounds versus the values for the same compounds divided into three groups of 80 species. Other than the five compounds circled, most molecules have very similar logPC values in the larger or smaller groups (R2 = 0.86, excluding the circled outliers). (b) The mass spectrometry and confocal fluorescence microscopy assays of partition coefficients yield similar values for most species. Plots show correlations between logPC values measured by mass spectrometry and confocal fluorescence microscopy for the indicated condensates. Red and grey lines show linear fit of the data and diagonal, respectively. Source data
Extended Data Fig. 4
Extended Data Fig. 4. Each condensate shows a wide range of partition coefficients for the small molecules.
Scatter plot of partition coefficients, ordered from smallest to largest, for 1296, 1213, and 1296 compounds into (a) SH3PRM, (b) Dhh1 and (c) cGASDNA condensates, respectively. In each panel the red dotted lines indicate logPC = 0 and green dotted lines indicate logPCscaffold (2.0, 2.1, and 2.3, respectively). The grey-colored areas represent bar plots for the mean values of the data, and green and purple dots represent metabolites and drug compounds, respectively. (d) Partitioning of small molecules is correlated between the different condensates. Scatter plots of logPC values for compounds into cGASDNA versus SH3PRM condensates, Dhh1 versus SH3PRM condensates, and Dhh1 versus cGASDNA condensates. Red and grey lines show linear fit of the data and diagonal, respectively. Source data
Extended Data Fig. 5
Extended Data Fig. 5. Correlations in subsampled windows between PCs of small molecules in different condensate systems.
In panel A, each pixel in the raster images represents the Pearson correlation coefficient r between PC values of small molecules in each pair of condensate systems, with the PC data subsampled with a normally distributed bias with mean and SD parameters as indicated on the x- and y-axes, respectively. The red contour line indicates the r value for the complete (that is, not subsampled) dataset. The images are thus a qualitative representation of the range of PC values over which correlations between each pair of condensate systems become apparent. The color scale is the same in all images. (B) Differential partitioning of compounds in each pair of condensate systems. Each plot shows -log10(p-value) as a function of log10(fold-change) in PC for each compound that was detected in all four condensate systems (977 compounds). Compounds were considered significantly differentially enriched in a given condensate if P < 0.01 and fold change in PC > 10 and are colored red or blue. Compounds that did not exhibit significant differential partitioning are colored gray. (C) Pearson r and R2 values for each condensate PC comparison values calculated for complete PC range and subset of PC values between 0.9 and 13. Source data
Extended Data Fig. 6
Extended Data Fig. 6. Specifically enriched compounds.
(a) Based on the data in Extended Data Fig. 5, the figure illustrates the compounds that are specifically enriched in the SUMOSIM, cGASDNA and Dhh1 condensates relative to all other condensates (see Supplementary Methods for analysis methods). No compounds were specifically enriched in the SH3PRM condensates. (b) A UMAP based on QuikProp features showing small molecules that showed specific enrichment in various condensates. Out of the library of metabolites and FDA-approved drugs, sixteen compounds showed specific enrichment in cGAS condensates (Red), 15 in Dhh1 condensates (green) and five in SUMOSIM condensates (blue). There were no small molecules that were specifically enriched in SH3PRM condensates (Supplementary Table 12). Compounds without specific enrichment in any condensate are colored grey. The small molecules occupy distinct regions within chemical space, suggesting the absence of common physicochemical attributes responsible for differential enrichment among specific condensate systems. Note the UMAP here differs from that in Extended Data Fig. 1 because it was generated with a different initial seed. UMAP analysis of specifically enriched compounds based on MACCS keys. Source data
Extended Data Fig. 7
Extended Data Fig. 7. Chemical structures of the ten most strongly partitioning compounds for each of the four condensates.
The collection of strongly partitioning molecules exhibits a diverse range of functional groups, lacking a singular shared structural motif across all compounds. Among the small molecules, the inclusion of unsaturated or aromatic rings is prevalent, although certain condensates display considerable enrichment of linear, highly saturated molecules (for example, Alexidine in SH3PRM condensates). Both straightforward ring systems, exemplified by Ethoxyquin, and intricate, stereochemically complex ring systems like Algestone acetophenide (and other steroids) demonstrate a pronounced capacity for substantial enrichment. Notably, polarizable functional groups such as nitro groups and halogens emerge as favored moieties within the highly enriched molecules. Nonetheless, their presence is not required for strong enrichment. These findings indicate that the general basis of partitioning is not governed by stereospecific interactions between small molecules and condensates.
Extended Data Fig. 8
Extended Data Fig. 8. Extreme gradient boosting (XGBoost) models of other condensates.
Shown are models of (a) SH3PRM, (b) Dhh1, and (c) cGASDNA, where the black line shows linear fit of the diagonal. MAE = mean absolute error. (d) Z-test comparison of enriched (N = 651) vs. excluded (N = 307) molecules for the top features in SUMOSIM model. Enriched molecules (blue) had measured log10PC greater than zero and excluded molecules (gray) had measured log10PC less than or equal to zero. Source data
Extended Data Fig. 9
Extended Data Fig. 9. Shapley Additive Explanations (SHAP) feature importance analysis of the three additional condensates.
(a) Feature importance is computed as the average impact on the model predictions when the specified feature is neglected from the XGBoost model. (b) SHAP decomposes each prediction into the contributions of each feature, which reveals the relative importance of different features and their interactions in determining specific outcomes from the XGBoost models. (c) XGBoost model trained on top features of SUMOSIM buffer model. (d) The six most important QikProp descriptors (as indicated by SHAP values, Fig. 3) resulted in an XGB model that had slightly poorer statistics than the analogous model trained on all QikProp features (Test R2 = 0.44 vs 0.47, test MAE = 0.51 vs 0.49). (e) Comparison of SHAP analysis of the two models indicated that the SHAP value magnitudes were similar across models, although there were minor fluctuations in the ordering in feature importance. Source data
Extended Data Fig. 10
Extended Data Fig. 10. Univariate linear regression models of small molecules partitioning.
(a) The top features identified from the full XGBoost model of the SUMOSIM condensate were subjected to univariate linear regression analysis. The resultant models demonstrated that linear fits to top descriptors are not sufficient to capture the impact of small molecules partitioning into SUMOSIM condensates in buffer. (b) Analysis of small molecule data for SUMOSIM condensates in U2OS cell lysate. XGBoost model of small molecules partitioning into SUMOSIM condensates in U2OS cell lysate (N train = 320 (black), N test = 131 (red), train R2 = 0.78+/− 0.01, train MAE = 0.18+/− 0.01, test R2 = 0.34+/− 0.11, test MAE = 0.28+/− 0.03). Validation set predictions (N train = 451 (not shown), N validation = 90 (red), validation R2 = 0.42+/− 0.07, validation MAE = 0.4451, +/− 0.03). Shapley Additive Explanations (SHAP) feature importance analysis showing the relative feature importance of the top SUMOSIM U2OS lysate model. SHAP decomposition showing the impact of features on each model prediction shows nonlinearity between small molecule feature values and measured partitioning behavior. (c) Analysis of small molecule data for SUMOSIM condensates in Xenopus laevis oocyte extract. XGBoost model of small molecules partitioning (N train = 366 (black), N test = 162 (red), train R2 = 0.75+/− 0.01, train MAE = 0.21+/− 0.02, test R2 = 0.36+/− 0.06, test MAE = 0.32+/− 0.02). B. Validation set predictions (N train = 528 (not shown), N validation = 106 (red), validation R2 = 0.36+/− 0.09, validation MAE = 0.30, +/− 0.02). Shapley Additive Explanations (SHAP) feature importance analysis showing the relative feature importance of the top SUMOSIM Xenopus laevis oocyte extract model. SHAP decomposition showing the impact of features on each model prediction shows nonlinearity between small molecule feature values and measured partitioning behavior. Source data

References

    1. Banani, S. F., Lee, H. O., Hyman, A. A. & Rosen, M. K. Biomolecular condensates: organizers of cellular biochemistry. Nat. Rev. Mol. Cell Biol.18, 285–298 (2017). - PMC - PubMed
    1. Shin, Y. & Brangwynne, C. P. Liquid phase condensation in cell physiology and disease. Science357, eaaf4382 (2017). - PubMed
    1. Choi, J. M., Holehouse, A. S. & Pappu, R. V. Physical principles underlying the complex biology of intracellular phase transitions. Annu. Rev. Biophys.49, 107–133 (2020). - PMC - PubMed
    1. Mathieu, C., Pappu, R. V. & Taylor, J. P. Beyond aggregation: pathological phase transitions in neurodegenerative disease. Science370, 56–60 (2020). - PMC - PubMed
    1. Mehta, S. & Zhang, J. Liquid–liquid phase separation drives cellular function and dysfunction in cancer. Nat. Rev. Cancer22, 239–252 (2022). - PMC - PubMed

Publication types

MeSH terms

Substances

LinkOut - more resources