. 2024 Sep 13;12(1):103.
doi: 10.1186/s40364-024-00636-3.

Single-cell, single-nucleus and xenium-based spatial transcriptomics analyses reveal inflammatory activation and altered cell interactions in the hippocampus in mice with temporal lobe epilepsy

Affiliations

Single-cell, single-nucleus and xenium-based spatial transcriptomics analyses reveal inflammatory activation and altered cell interactions in the hippocampus in mice with temporal lobe epilepsy

Quanlei Liu et al. Biomark Res. .

Abstract

Background: Temporal lobe epilepsy (TLE) is among the most common types of epilepsy and often leads to cognitive, emotional, and psychiatric issues due to the frequent seizures. A notable pathological change related to TLE is hippocampal sclerosis (HS), which is characterized by neuronal loss, gliosis, and an increased neuron fibre density. The mechanisms underlying TLE-HS development remain unclear, but the reactive transcriptomic changes in glial cells and neurons of the hippocampus post-epileptogenesis may provide insights.

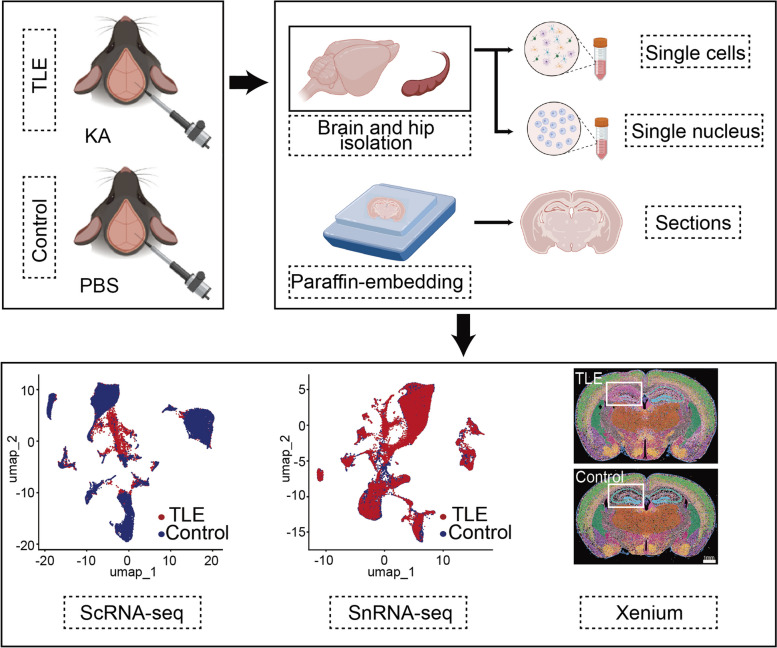
Methods: To induce TLE, 200 nl of kainic acid (KA) was stereotactically injected into the hippocampal CA1 region of mice, followed by a 7-day postinjection period. Single-cell RNA sequencing (ScRNA-seq), single-nucleus RNA sequencing (SnRNA-seq), and Xenium-based spatial transcriptomics analyses were employed to evaluate the changes in mRNA expression in glial cells and neurons.

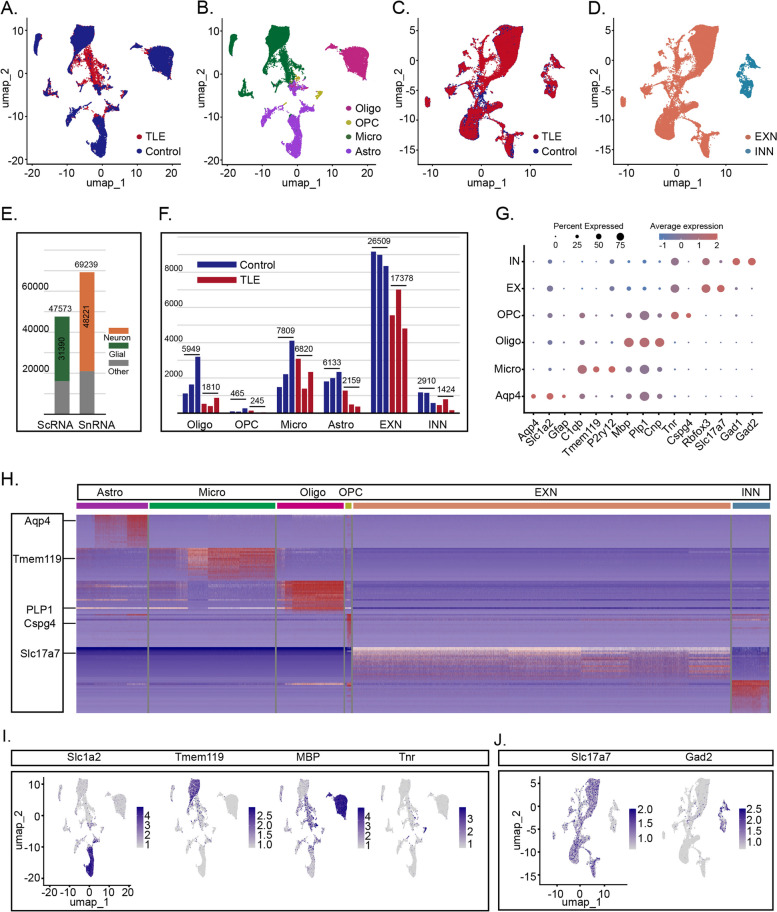
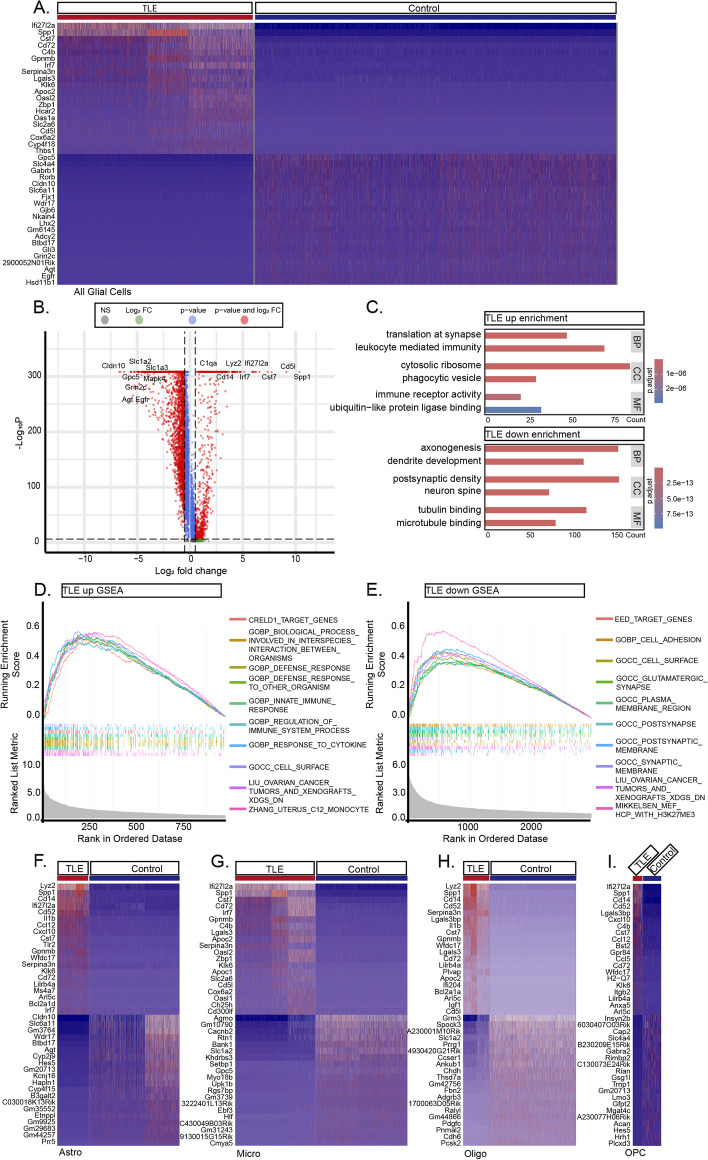
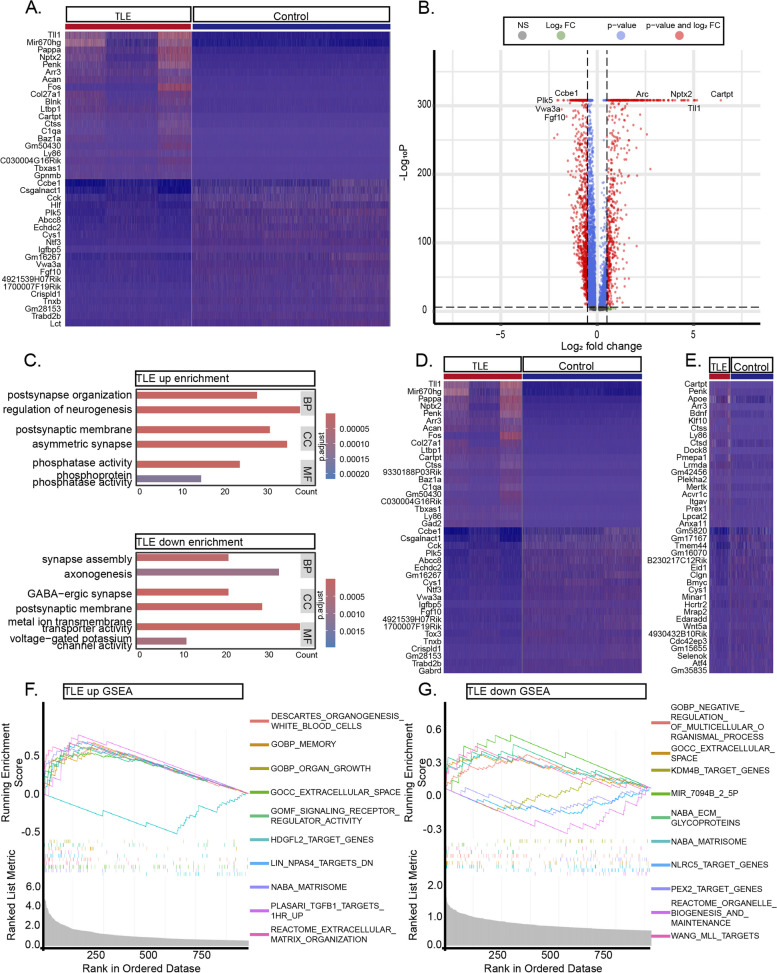
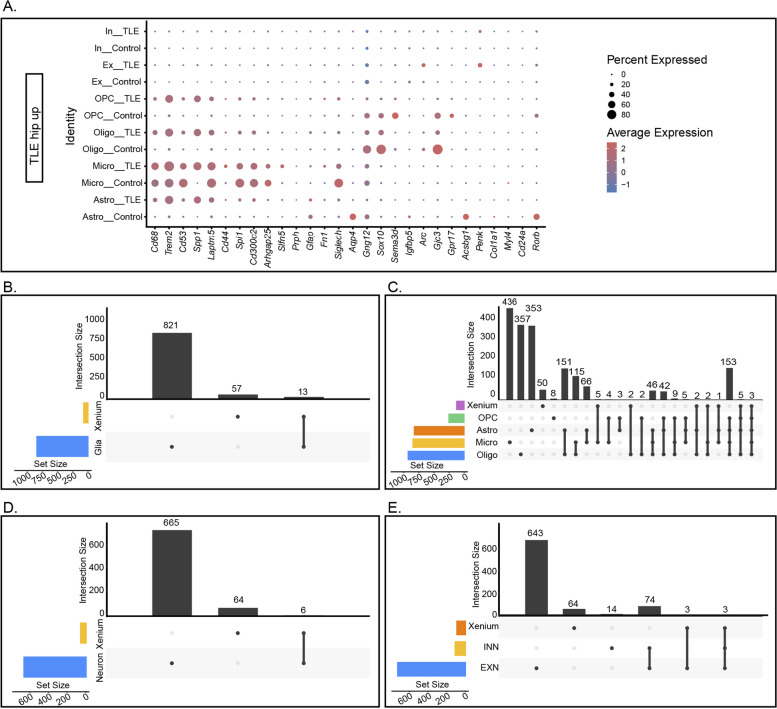
Results: From the ScRNA-seq and SnRNA-seq data, 31,390 glial cells and 48,221 neuronal nuclei were identified. Analysis of the differentially expressed genes (DEGs) revealed significant transcriptomic alterations in the hippocampal cells of mice with TLE, affecting hundreds to thousands of mRNAs and their signalling pathways. Enrichment analysis indicated notable activation of stress and inflammatory pathways in the TLE hippocampus, while pathways related to axonal development and neural support were suppressed. Xenium analysis demonstrated the expression of all 247 genes across mouse brain sections, revealing the spatial distributions of their expression in 27 cell types. Integrated analysis of the DEGs identified via the three sequencing techniques revealed that Spp1, Trem2, and Cd68 were upregulated in all glial cell types and in the Xenium data; Penk, Sorcs3, and Plekha2 were upregulated in all neuronal cell types and in the Xenium data; and Tle4 and Sipa1l3 were downregulated in all glial cell types and in the Xenium data.

Conclusion: In this study, a high-resolution single-cell transcriptomic atlas of the hippocampus in mice with TLE was established, revealing potential intrinsic mechanisms driving TLE-associated inflammatory activation and altered cell interactions. These findings provide valuable insights for further exploration of HS development and epileptogenesis.

Keywords: Single-cell RNA sequencing; Single-nucleus RNA sequencing; Temporal lobe epilepsy; Xenium-based spatial transcriptomics.


Conflict of interest statement

The authors declare no competing interests.

Figures

Fig. 1
Fig. 1
Flow chart of this study (Created with BioRender.com)
Fig. 2
Fig. 2
ScRNA-seq and SnRNA-seq Analyses of TLE and Control Hippocampus Samples. A-B UMAP plot of all glial cells in TLE and control hippocampi. C-D UMAP plot of all neurons in TLE and control hippocampi. E The green portion indicates the number of glial cells selected from the entire scRNA-seq dataset, while the orange portion represents the number of neurons selected from the entire snRNA-seq dataset. F Each bar represents an individual mouse, and the number labels indicating the total number of cells from three mice in the same group. G Expression levels of various marker genes used for the definition of cells in each cluster. H A combined gene expression heatmaps of glial cells from the ScRNA-seq and neurons from the SnRNA-seq data. I-J Representative UMAP plots showing the expression of marker genes in various glial cells and neurons
Fig. 3
Fig. 3
DEGs in Glial Cells Overall and Among Different Clusters. A Heatmap representation of the top 20 differentially expressed mRNAs in glial cells between TLE and control hippocampi. B Representative volcano plot showing the major DEGs in glial cells between TLE and control hippocampi. C GO enrichment analysis of the major upregulated and downregulated genes in the TLE group (BP: biological process; CC: cellular component; MF: molecular function). D-E GSEA analysis results for genes with elevated expression (D) and reduced expression (E) in glial cells of TLE group. F-I Representative heatmaps of the top 20 DEGs (P < 0.05 and Log2FC > 0.5) in astrocytes, microglia, oligodendrocytes, and OPCs in TLE and control hippocampi
Fig. 4
Fig. 4
DEGs in Overall Neurons, EXNs, and INNs. A Heatmap representation of the top 20 differentially expressed mRNAs in neurons between TLE and control hippocampi. B Representative volcano plot of the major DEGs in neurons between TLE and control hippocampi. C GO enrichment analysis of the major upregulated and downregulated genes in the TLE group. D-E Representative heatmaps of the top 20 DEGs in EXNs and INNs in TLE and control hippocampi. F-G: GSEA analysis results for genes with elevated expression (F) and reduced expression (G) in neurons of TLE group
Fig. 5
Fig. 5
Changes in Interactions Between Cells in the TLE Hippocampus, as Revealed by ScRNA-seq and SnRNA-seq. A Differential numbers of interactions within each cluster in the TLE and control hippocampus. B Differential interaction strengths within each cluster of the TLE and control hippocampus. C-D Relative information flow of the altered cell communication events. EF Interactions mediated via the Spp1 and NT signalling pathway were significantly activated only in the TLE hippocampus. In the circle plots and chord diagrams, the thickness of the connecting lines between different clusters represents the strength of the correlation. No interactions mediated via these two pathways were observed in the control group. G-H Interactions mediated via the Psap and Ptn signalling pathway exhibited significant differences between TLE and control hippocampi. For the Pasp pathway, the complexity of interactions between different cell types was significantly reduced. For example, the output from microglia to astrocytes and the interactions within astrocytes were notably decreased (G). For the Ptn pathway, only the output from oligodendrocytes to other cells remained active in the TLE group (H)
Fig. 6
Fig. 6
Xenium-Based Spatial Transcriptomics Analysis of TLE and Control Mouse Brain Sections. A Whole-brain transcriptomic information obtained through Xenium-based spatial transcriptomics analysis, with reconstructed cell bodies displayed in different colours. The white box highlights the TLE and control hippocampal regions. B Enlarged view of the hippocampal region highlighted in A. C UMAP plot showing the 27 identified cell types. D-I High-resolution expression patterns of marker genes for astrocytes, microglia, oligodendrocytes, CA1 pyramidal neurons, dentate gyrus granule cells, and CA3 pyramidal neurons in Control and TLE sections. The left side represents the brain of a control mouse, while the right side represents the brain of a TLE mouse. Each red dot represents a positive expression point for a gene, with a diameter of 5 μm
Fig. 7
Fig. 7
DEGs Between TLE and Control Hippocampi, as Revealed via the Xenium Platform. A The top 28 upregulated mRNAs and the top 40 downregulated mRNAs in the TLE hippocampus identified in the Xenium data (P < 0.01 and Log2FC > 20). B Representative volcano plot of the differentially expressed genes in the hippocampus. C GO enrichment analysis based on the differentially expressed genes between TLE and control hippocampi. D High-resolution spatial distribution of the top 5 upregulated mRNAs (Gfap, Aqp4, Laptm5, Spp1, and Cd68) in the TLE hippocampus. E High-resolution spatial distribution of the top 5 downregulated mRNAs (Cpne6, Slc17a7, Neurod6, Rab3b, and Epha4) in the TLE hippocampus
Fig. 8
Fig. 8
Analysis of Genes Identified as Upregulated in Both the Xenium Data and the ScRNA-seq/SnRNA-seq Data. A Distribution of the top 28 upregulated genes identified in the Xenium data among various glial cells and neurons. B-C Correlation of genes upregulated in the Xenium data with similar trends in overall glial cells and specific clusters. The colour bars on the horizontal axis represent the DEGs between the groups for the corresponding clusters, while the grey bars indicate the cluster-specific DEGs associated with the black dots. D-E Correlations of genes identified as upregulated in the Xenium data with similar trends in overall neurons, EXNs, and INNs
Fig. 9
Fig. 9
Analysis of Genes Downregulated in Both the Xenium Data and the ScRNA-seq/SnRNA-seq Data. A Distribution of the top 40 downregulated genes identified in the Xenium data among various glial cells and neurons. B-C Correlation of genes identified as downregulated in the Xenium data with similar trends in overall glial cells and specific clusters. D-E Correlations of genes identified as downregulated in the Xenium data with similar trends in overall neurons, EXNs, and INNs

References

    1. Asadi-Pooya AA, Brigo F, Lattanzi S, Blumcke I. Adult epilepsy. Lancet. 2023;402(10399):412–24. 10.1016/S0140-6736(23)01048-6 - DOI - PubMed
    1. Li Y, Liu P, Lin Q, Zhou D, An D. Postoperative seizure and memory outcome of temporal lobe epilepsy with hippocampal sclerosis: A systematic review. Epilepsia. 2023;64(11):2845–60. 10.1111/epi.17757 - DOI - PubMed
    1. Devinsky O, Vezzani A, O’Brien TJ, Jette N, Scheffer IE, de Curtis M, Perucca P. Epilepsy. Nat Rev Dis Primers. 2018;4:18024. 10.1038/nrdp.2018.24 - DOI - PubMed
    1. Pease M, Gupta K, Moshé SL, Correa DJ, Galanopoulou AS, Okonkwo DO, Gonzalez-Martinez J, Shutter L, Diaz-Arrastia R, Castellano JF. Insights into epileptogenesis from post-traumatic epilepsy. Nat Rev Neurol. 2024;20(5):298–312. 10.1038/s41582-024-00954-y - DOI - PMC - PubMed
    1. Ravizza T, Scheper M, Di Sapia R, Gorter J, Aronica E, Vezzani A. mTOR and neuroinflammation in epilepsy: implications for disease progression and treatment. Nat Rev Neurosci. 2024;25(5):334–50. 10.1038/s41583-024-00805-1 - DOI - PubMed

LinkOut - more resources