. 2024 Sep 13;26(1):132.
doi: 10.1186/s13058-024-01876-9.

A triple hormone receptor ER, AR, and VDR signature is a robust prognosis predictor in breast cancer

Affiliations

A triple hormone receptor ER, AR, and VDR signature is a robust prognosis predictor in breast cancer

Mohamed Omar et al. Breast Cancer Res. .

Abstract

Background: Despite evidence indicating the dominance of cell-of-origin signatures in molecular tumor patterns, translating these genome-wide patterns into actionable insights has been challenging. This study introduces breast cancer cell-of-origin signatures that offer significant prognostic value across all breast cancer subtypes and various clinical cohorts, compared to previously developed genomic signatures.

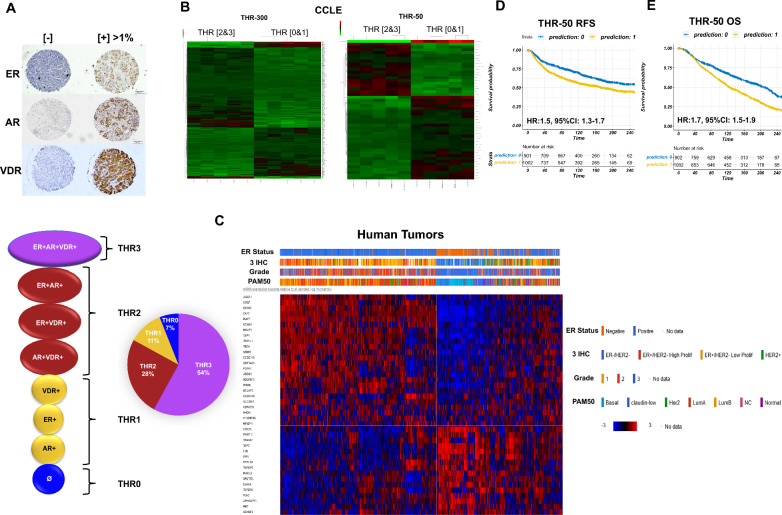
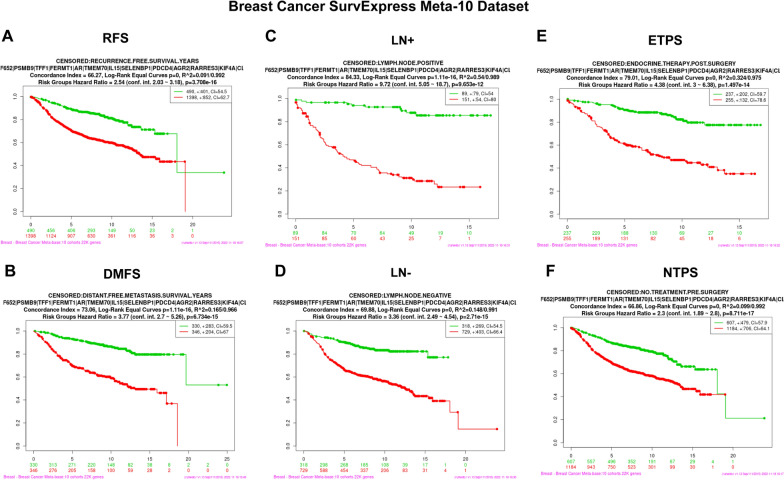
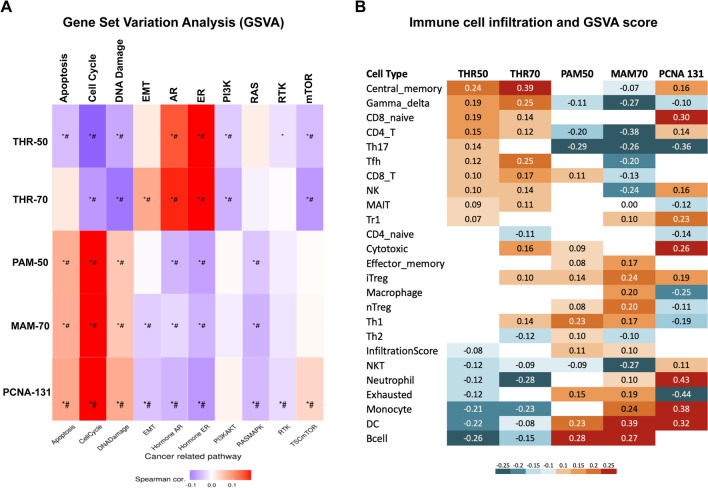
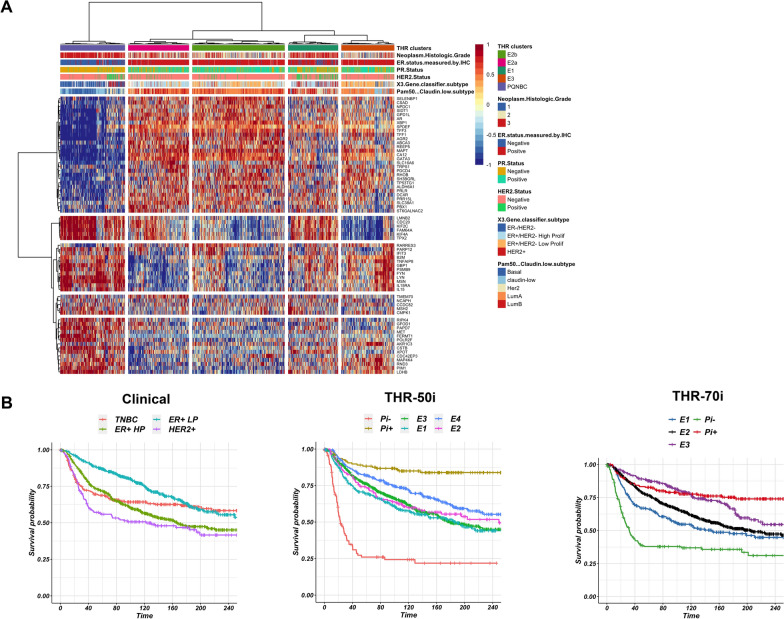
Methods: We previously reported that triple hormone receptor (THR) co-expression patterns of androgen (AR), estrogen (ER), and vitamin D (VDR) receptors are maintained at the protein level in human breast cancers. Here, we developed corresponding mRNA signatures (THR-50 and THR-70) based on these patterns to categorize breast tumors by their THR expression levels. The THR mRNA signatures were evaluated across 56 breast cancer datasets (5040 patients) using Kaplan-Meier survival analysis, Cox proportional hazard regression, and unsupervised clustering.

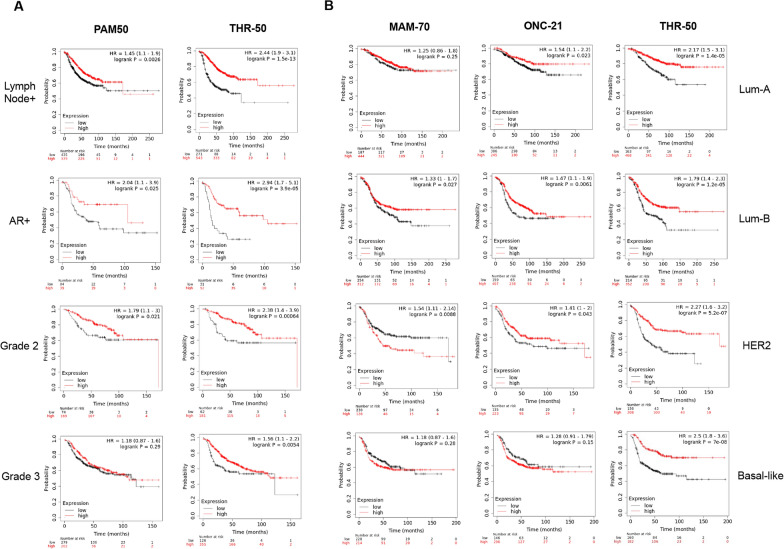
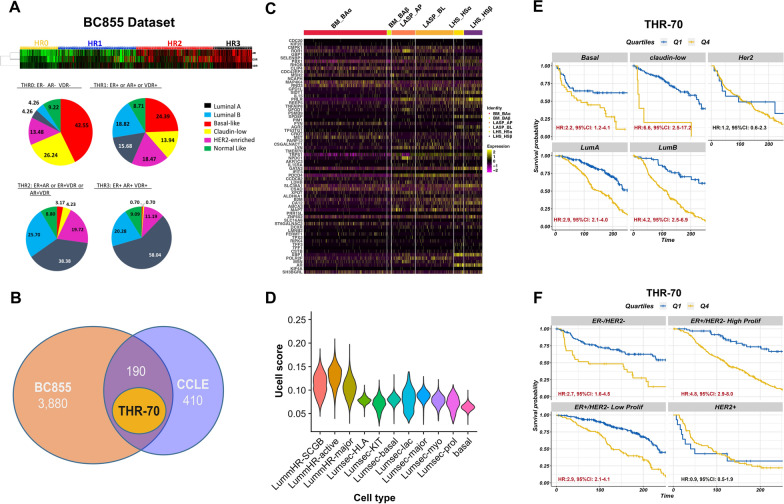
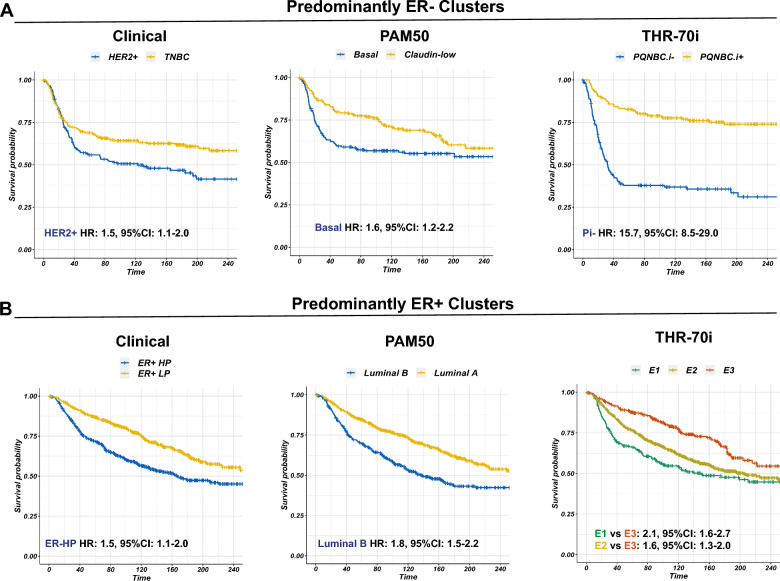
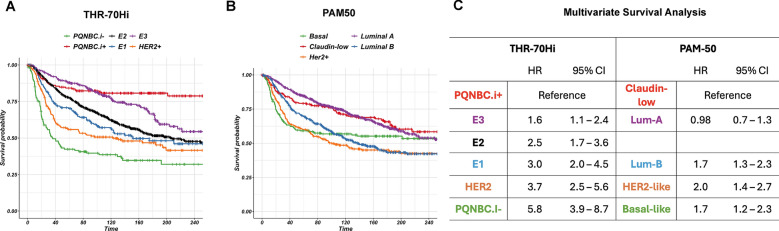
Results: The THR signatures effectively predict both overall and progression-free survival across all evaluated datasets, independent of subtype, grade, or treatment status, suggesting improvement over existing prognostic signatures. Furthermore, they delineate three distinct ER-positive breast cancer subtypes with significant survival in differences-expanding on the conventional two subtypes. Additionally, coupling THR-70 with an immune signature identifies a predominantly ER-negative breast cancer subgroup with a highly favorable prognosis, comparable to ER-positive cases, as well as an ER-negative subgroup with notably poor outcome, characterized by a 15-fold shorter survival.

Conclusions: The THR cell-of-origin signature introduces a novel dimension to breast cancer biology, potentially serving as a robust foundation for integrating additional prognostic biomarkers. These signatures offer utility as a prognostic index for stratifying existing breast cancer subtypes and for de novo classification of breast cancer cases. Moreover, THR signatures may also hold promise in predicting hormone treatment responses targeting AR and/or VDR.

Keywords: Androgen receptor; Breast cancer; Breast cancer subtypes; Cell-of-origin; Estrogen receptor; Predictive modeling; Survival; Triple hormone receptor; Vitamin D receptor.


Conflict of interest statement

The authors declare no competing interests.

Figures

Fig. 1
Fig. 1
Breast cancer classification based on triple-hormone receptor (THR) expression. A Immunohistochemical (IHC) staining with ER, AR, and VDR of tissue microarrays (TMAs) from breast cancer patients (top) identifies four distinct subtypes (bottom). Hormone receptor positive tumors were identified as those with > 1% protein expression. B Heatmaps showing the expression of the top 300 (left) and top 50 (right) differentially expressed genes between THR-[0/1] and THR-[2/3] cell lines in the Cancer Cell Line Encyclopedia (CCLE) dataset. C Heatmap showing the expression of the THR-50 genes in human samples from the Molecular Taxonomy of Breast Cancer International Consortium (METABRIC) cohort. The heatmap shows the samples annotation including ER status measured by IHC, clinical 3-gene classifier groups (based on ER, HER2, and MIB-1), histological grade, and PAM-50 groups. Red = high expression, blue = low expression. D–E Kaplan–Meier survival plots show the difference in recurrence-free survival (RFS) (D) and overall survival (OS) (E) between METABRIC samples predicted as 0 (low-risk) and 1 (high-risk) by THR-50. High-risk samples have significantly worse RFS (HR = 1.5, 95%CI: 1.3–1.7, p < 0.0001) and OS (HR = 1.7, 95%CI: 1.5–1.9, p < 0.0001) compared to low-risk samples. Survival time is in months. The hazard ratios and 95% confidence intervals are shown. THR: triple-hormone receptors; HR: hazard ratio; CI: confidence interval
Fig. 2
Fig. 2
THR-50 is significantly associated with recurrence-free survival (RFS) across different breast cancer clinical groups, outperforming established tests in the KMP cohort. A Kaplan–Meier survival plots comparing the prognostic power of THR-50 with PAM-50 using RFS in lymph-node positive, androgen receptor (AR) positive (AR +), grade 2 and grad 3 breast cancer. The analysis uses an independent validation cohort (KMP) comprising 2,032 samples from 50 gene expression datasets. Low (black line) and high (red line) expression groups are defined based on optimum cutoffs of the average expression levels of all signature genes. The reported p-values are derived from the log-rank test. The hazard ratios (HR) along with their corresponding 95% confidence intervals (CI) are shown. THR-50 results: lymph-node positive (HR = 2.4, CI:1.9–3.1, p = 1.5e-13), AR + (HR = 4.5, CI:2.0–11.0, p = 0.0001), Grade 2 (HR = 2.0, CI:1.1– 4.0, p = 0.02), Grade 3 (HR = 1.6, CI:1.1–2.5, p =  p = 0.02). PAM-50 results: lymph-node positive (HR = 1.4, CI:1.1–1.9, p = 0.0026), AR + (HR = 2.0, CI:1.1–3.9, p = 0.025), Grade 2 (HR = 1.8, CI:1.1–3.0, p = 0.021), Grade 3 (p = 0.29). B Kaplan–Meier survival plots comparing the RFS between patients with low and high average expression of THR-50 genes across different PAM-50 groups: Lum-A (HR = 2.1, CI = 1.5–3.1, p = 1.4e-05), Lum-B (HR = 1.8, CI = 1.4–2.3, p = 1.2e-05), HER2-like (HR = 2.3, CI = 1.6–3.2, p = 5.2e-07), basal-like (HR = 2.5, CI = 1.8–3.6, p = 7e-08). The plot also shows Oncotype DX (ONC-21), and MammaPrint (MAM-70) HR, 95% CI, and p-values. CI: 95% confidence interval. HR: hazard ratio
Fig. 3
Fig. 3
Development and validation of THR-70. A Heatmap showing the expression of the three hormone receptors ER, AR, and VDR across the different triple hormone receptor (THR) groups (top). The Pie charts (bottom) show the percentages of PAM-50 subtypes in the different THR groups in the BC855 cohort. B Venn diagram showing the genes in common between the top differentially expressed genes (DEGs) between the THR-0/1 and THR-2/3 groups in the CCLE and BC855 cohorts, using p < 0.05 as a cut-off. The THR-70 signature comprises the top 70 DEGs in common between both cohorts based on SAM-fold expression. C Heatmap of the expression of THR-70 genes in normal breast epithelial clusters reported in Bhat-Nakshatri et al. Expression levels are z-score transformed. D Violin plots comparing the enrichment of THR-70 across normal breast epithelial clusters identified by Kumar et al. Signature scores (normalized U statistics between 0 and 1), shown on the Y axis, were computed using UCell. E–F Kaplan–Meier survival plots in the METABRIC cohort comparing the overall survival (OS) between patients predicted as low (Q1) and high-risk (Q4) by THR-70. The high-risk samples have significantly worse OS compared to low-risk samples in the PAM-50 basal (HR = 2.2, 95%CI: 1.2–4.1, p = 0.01), Claudin-low (HR = 6.6, 95%CI: 2.5–17.2), Luminal A (HR = 2.9, 95%CI: 2.1–4.0, p < 0.0001), and Luminal B (HR = 4.2, 95%CI: 2.5–6.9, p < 0.0001) (E). Additionally, in clinical 3-gene classifier ER-/HER2- (HR = 2.7, 95%CI: 1.6–4.5, p < 0.0001), ER + /HER2- high proliferation (HR = 4.8, 95%CI: 2.9–8.0, p < 0.0001), and ER + /HER2- low proliferation (HR = 2.9, 95%CI: 2.1–4.1, p < 0.0001) (F). Survival time is in months. Hazard ratios (HR) and 95% confidence intervals (CI) are shown. Statistically significant HRs are highlighted in red
Fig. 4
Fig. 4
THR-70 is prognostic in the SurvExpress Meta-10 cohort, comprising samples from 10 different datasets. THR-70 shows a significant association with recurrence-free survival (RFS, HR = 2.5 CI: 2.0—3.1, p = 3.7e-16) (A) and distant metastasis-free survival (DMFS, HR = 3.7 CI: 2.7—5.6, p = 6.7e-15) (B). It is prognostic in both lymph node positive (LN + , HR = 9.7 CI: 5.0—18.7, p = 9.6e-12) (C) and negative (LN-, HR = 3.3 CI: 2.4—4.5, p = 2.7e-15) (D) disease, as well as in patients treated with endocrine therapy post surgery (ETPS, HR = 4.3 CI: 3.0—6.3, p = 1.4e-14) (E), and those who did not receive neoadjuvant treatment (NTPS, HR = 2.3 CI: 1.8—2.8, p = 8.7e-17) (F). 95% confidence interval (CI); hazard ratio (HR)
Fig. 5
Fig. 5
The THR signatures are enriched in ER, AR, and immune pathways in gene set variation analysis (GSVA). A Heatmap showing the Spearman correlation coefficients between different breast cancer signatures (rows) and key cancer-associated pathways and biological processes (columns). Positive correlation (red), negative correlation (blue), p-value < 0.05 (*), false discovery rate (FDR) < 0.05 (#). B Immune cell type enrichment score heatmap (rows) in different breast cancer signatures (columns). Positive enrichment (red) and negative enrichment (blue)
Fig. 6
Fig. 6
Unsupervised clustering based on THR-70 uncovers five distinct breast cancer groups in the METABRIC cohort. A Heatmap showing the expression of THR-70 genes in the METABRIC cohort. Five distinct groups were identified: E1, E2a, E2b, E3, and PQNBC. B Kaplan–Meier survival plots comparing the 20 years recurrence-free survival (RFS) rates between different breast cancer groups identified by the by the 3-gene (ER, HER2, Mib-1 IHC) classifier (clinical), THR-50 combined with i20 (THR-50i), and THR-70 combined with i20 (THR-70i) signatures. THR: triple-hormone receptor. Pi + : pentaplex-negative (ER, PR, AR, VDR, and HER2), immune-positive tumors. Pi-: pentaplex-negative, immune-negative tumors. Survival time is in months
Fig. 7
Fig. 7
THR-70 improves the identification of ER-negative (ER-) and ER-positive (ER+) subgroups with distinct survival rates compared to the clinical 3-gene classifier and PAM-50. A Kaplan–Meier (KM) survival plots comparing the 20-year recurrence-free survival (RFS) in ER-negative breast cancer groups identified by clinical 3-gene classifier: HER2 + HR = 1.5, 95%CI: 1.1–2.0, p = 0.001 vs. TNBC (left panel); PAM-50 classifier: basal HR = 1.6, 95%CI: 1.2–2.2, p = 0.01 vs. claudin-low (middle panel), and THR-70i: PQNBC.i- HR = 15.7, 95%CI: 8.5–29.0, p < 0.0001 vs. PQNBC.i + (right panel). B KM plots comparing the 20-year RFS in ER + groups identified by clinical 3-gene classifier: ER + HP HR = 1.7, 95%CI: 1.4–2.1, p < 0.0001 vs. ER + LP (left panel), PAM-50: luminal B HR = 1.8, 95%CI: 1.5–2.2, p < 0.0001 vs. Luminal A (middle panel), and THR-70i: E1 HR = 2.1, 95%CI: 1.6–2.7, p <  p < 0.0001; E2 HR = 1.6, 95%CI: 1.3–2.0, p = 0.0001, VS. E3 (right panel). Survival time is in months. The hazard ratios (HR) and 95% confidence intervals (CI) are shown. HP: high proliferation, LP: low proliferation
Fig. 8
Fig. 8
THR-70 coupled with immune signature (i20) and HER2 (THR-70Hi) captures more granular breast cancer groups compared to PAM-50. A Kaplan–Meier (KM) survival chart shows 20-year recurrence-free survival (RFS) of different patient subgroups identified by THR-70, i20, and HER2 classifier (THR70-Hi): E3 (purple), E2 (black), E1 (blue), HER2 + (yellow), PQNBC.i- (green) and PQNBC.i + (red). PNBC subtype includes breast cancers that are negative for ER, PR, HER2, AR and VDR. QNBC subtype includes breast cancers that are negative for ER, PR, HER2, ∓ AR or VDR.  B KM survival chart shows 20-year RFS of different patient subgroups identified by PAM-50: Lum-A (purple), Lum-B (blue), HER2-like (yellow), basal-like (green), and claudin-low (red). C Multivariate analysis of Hazard ratios (HR) and 95% confidence interval (95% CI) for RFS by THR-70Hi and PAM-50 breast cancer groups using a Cox proportional hazards model

Similar articles

Cited by

References

    1. Khoury JD, Solary E, Abla O, Akkari Y, Alaggio R, Apperley JF, Bejar R, Berti E, Busque L, Chan JK, Chen W. The 5th edition of the World Health Organization classification of haematolymphoid tumours: myeloid and histiocytic/dendritic neoplasms. Leukemia. 2022;36(7):1703–19. 10.1038/s41375-022-01613-1 - DOI - PMC - PubMed
    1. Alaggio R, Amador C, Anagnostopoulos I, Attygalle AD, de Araujo IB, et al. The 5th edition of the World Health Organization Classification of Haematolymphoid Tumours: Lymphoid Neoplasms. Leukemia. 2022;36(7):1720–48. 10.1038/s41375-022-01620-2 - DOI - PMC - PubMed
    1. Santagata S, Thakkar A, Ergonul A, Wang B, Woo T, Hu R, et al. Taxonomy of breast cancer based on normal cell phenotype predicts outcome. J Clin Invest. 2014;124(2):859–70. 10.1172/JCI70941 - DOI - PMC - PubMed
    1. Santagata S, Ince TA. Normal cell phenotypes of breast epithelial cells provide the foundation of a breast cancer taxonomy. Expert Rev Anticancer Ther. 2014;14(12):1385–9. 10.1586/14737140.2014.956096 - DOI - PMC - PubMed
    1. Houseman EA, Kile ML, Christiani DC, Ince TA, Kelsey KT, Marsit CJ. Reference-free deconvolution of DNA methylation data and mediation by cell composition effects. BMC Bioinform. 2016;17(1):259.10.1186/s12859-016-1140-4 - DOI - PMC - PubMed