

Freshwater Mussel Viromes Increase Rapidly in Diversity and Abundance When Hosts Are Released from Captivity into the Wild
- PMID: 39272316
- PMCID: PMC11393864
- DOI: 10.3390/ani14172531
Freshwater Mussel Viromes Increase Rapidly in Diversity and Abundance When Hosts Are Released from Captivity into the Wild
Abstract
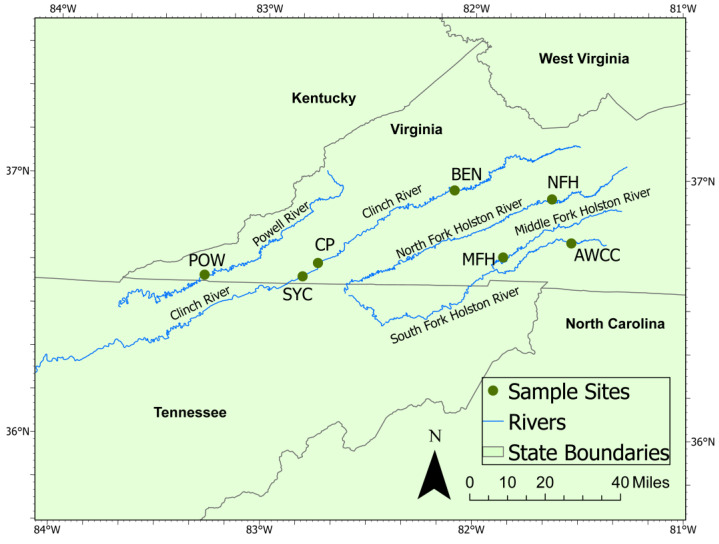
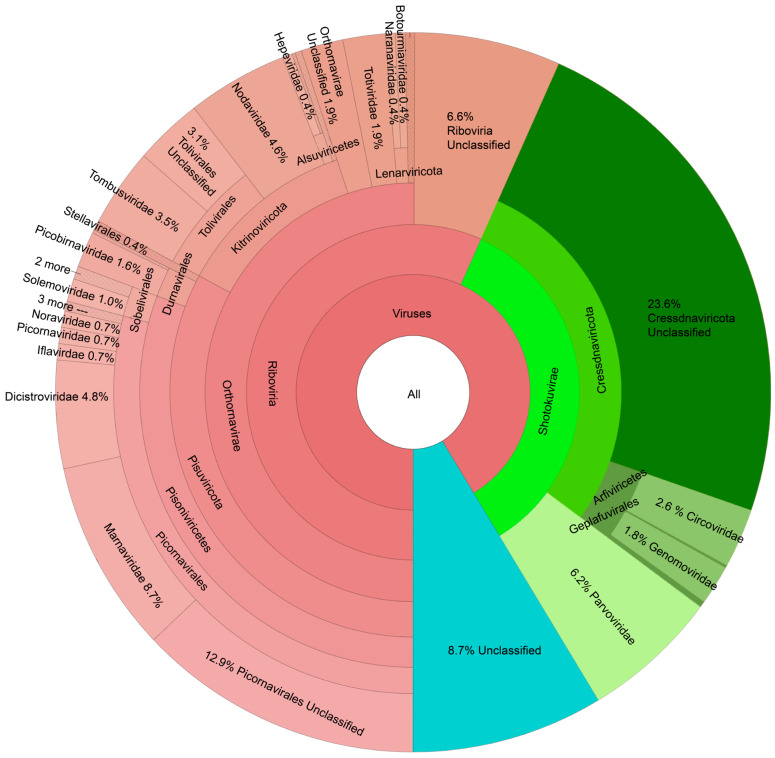
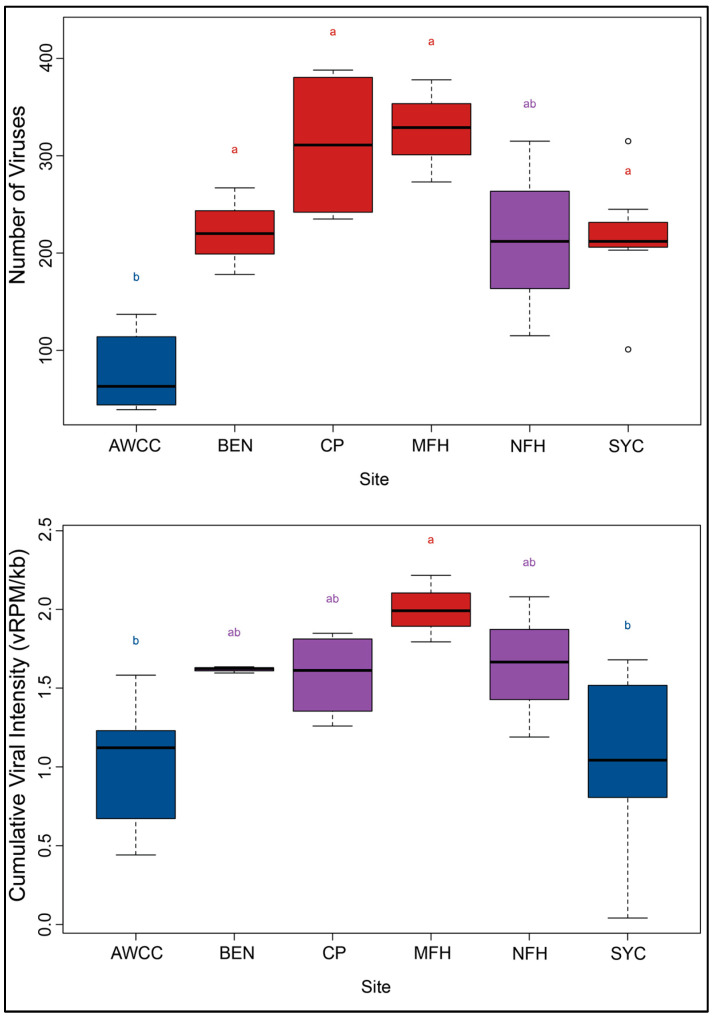
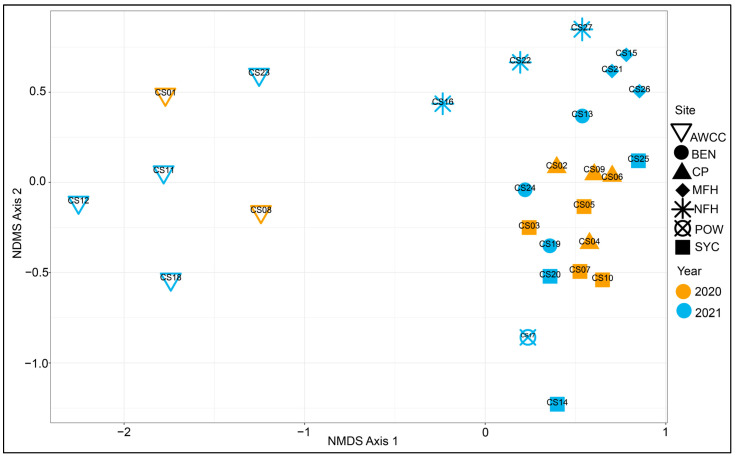
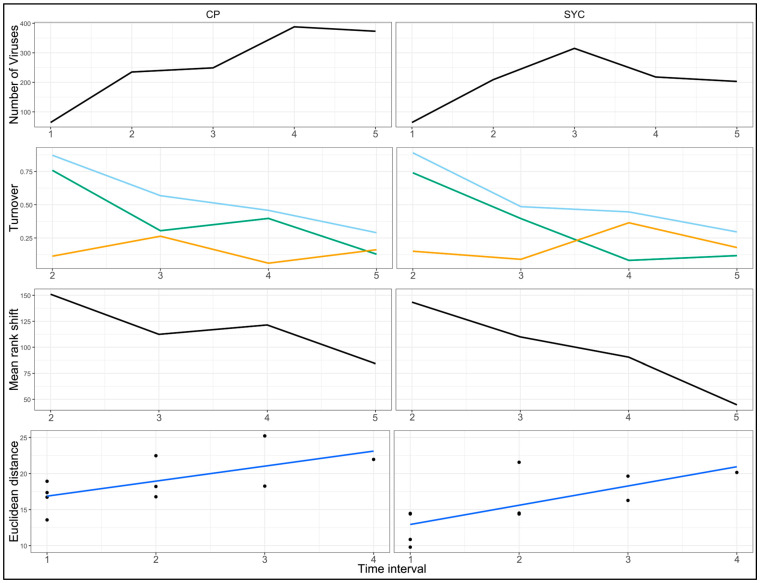
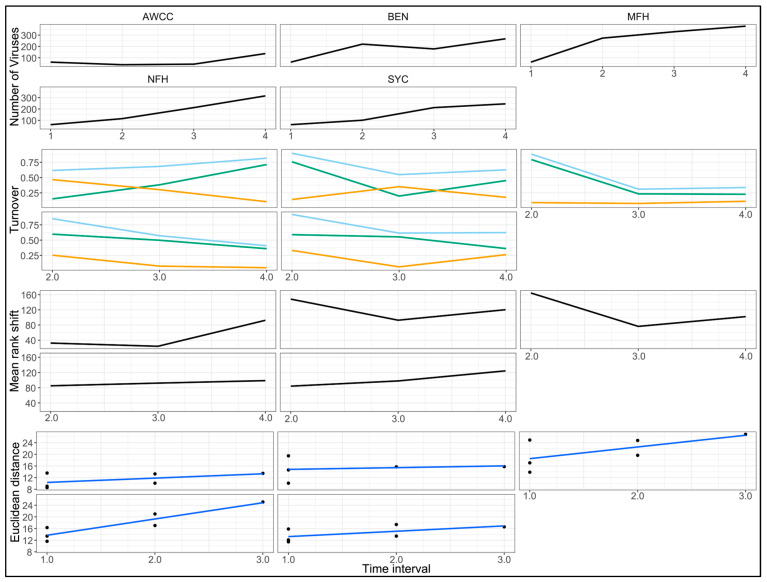
Freshwater mussels (order: Unionida) are highly imperiled globally and are increasingly the focus of captive propagation efforts to protect and restore wild populations. The Upper Tennessee River Basin (UTRB) in Virginia is a freshwater biodiversity hotspot hosting at least 45 of North America's ~300 species of freshwater mussels, including 21 threatened and endangered species listed under the U.S. Endangered Species Act. Recent studies have documented that viruses and other microbes have contributed to freshwater mussel population declines in the UTRB. We conducted a multi-year longitudinal study of captive-reared hatchery mussels released to restoration sites throughout the UTRB to evaluate their viromes and compare them to captive hatchery environments. We documented 681 viruses from 27 families. The hatchery mussels had significantly less viruses than those deployed to wild sites, with only 20 viruses unique to the hatchery mussels. After the hatchery mussels were released into the wild, their number of viruses initially spiked and then increased steadily over time, with 451 viruses in total unique to the mussels in the wild. We found Clinch densovirus 1 (CDNV-1), a virus previously associated with mass mortality events in the Clinch River, in all samples, but the wild site mussels consistently had significantly higher CDNV-1 levels than those held in the hatchery. Our data document substantial differences between the viruses in the mussels in the hatchery and wild environments and rapid virome shifts after the mussels are released to the wild sites. These findings indicate that mussel release programs might benefit from acclimatization periods or other measures to mitigate the potential negative effects of rapid exposure to infectious agents found in natural environments.
Keywords: aquaculture; conservation; die-off; endangered species; freshwater mussel; mass mortality event; restoration; unionid; virome; viruses.
Conflict of interest statement
The authors declare no conflicts of interest. The findings and conclusions in this article are those of the authors and do not necessarily represent the views of the USFWS but do represent the views of the U.S. Geological Survey. Any use of trade, firm, or product names is for descriptive purposes only and does not imply endorsement by the U.S. Government.
Figures
Similar articles
-
Systemic pharmacological treatments for chronic plaque psoriasis: a network meta-analysis.Cochrane Database Syst Rev. 2017 Dec 22;12(12):CD011535. doi: 10.1002/14651858.CD011535.pub2. Cochrane Database Syst Rev. 2017. Update in: Cochrane Database Syst Rev. 2020 Jan 9;1:CD011535. doi: 10.1002/14651858.CD011535.pub3. PMID: 29271481 Free PMC article. Updated.
-
Sexual Harassment and Prevention Training.2024 Mar 29. In: StatPearls [Internet]. Treasure Island (FL): StatPearls Publishing; 2025 Jan–. 2024 Mar 29. In: StatPearls [Internet]. Treasure Island (FL): StatPearls Publishing; 2025 Jan–. PMID: 36508513 Free Books & Documents.
-
Systemic pharmacological treatments for chronic plaque psoriasis: a network meta-analysis.Cochrane Database Syst Rev. 2021 Apr 19;4(4):CD011535. doi: 10.1002/14651858.CD011535.pub4. Cochrane Database Syst Rev. 2021. Update in: Cochrane Database Syst Rev. 2022 May 23;5:CD011535. doi: 10.1002/14651858.CD011535.pub5. PMID: 33871055 Free PMC article. Updated.
-
High densities of hatchery-origin white sturgeon suppress somatic growth rates of an endangered wild population.Ecol Appl. 2025 Jun;35(4):e70042. doi: 10.1002/eap.70042. Ecol Appl. 2025. PMID: 40548826
-
Home treatment for mental health problems: a systematic review.Health Technol Assess. 2001;5(15):1-139. doi: 10.3310/hta5150. Health Technol Assess. 2001. PMID: 11532236
Cited by
-
Introduction into natural environments shifts the gut microbiome of captivity-raised filter-feeding bivalves.ISME Commun. 2024 Oct 23;4(1):ycae125. doi: 10.1093/ismeco/ycae125. eCollection 2024 Jan. ISME Commun. 2024. PMID: 39507398 Free PMC article.
References
-
- Howard J.K., Cuffey K.M. The Functional Role of Native Freshwater Mussels in the Fluvial Benthic Environment. Freshw. Biol. 2006;51:460–474. doi: 10.1111/j.1365-2427.2005.01507.x. - DOI
-
- Vaughn C.C., Hakenkamp C.C. The Functional Role of Burrowing Bivalves in Freshwater Ecosystems. Freshw. Biol. 2001;46:1431–1446. doi: 10.1046/j.1365-2427.2001.00771.x. - DOI
-
- Vaughn C.C., Nichols S.J., Spooner D.E. Community and Foodweb Ecology of Freshwater Mussels. J. N. Am. Benthol. Soc. 2008;27:409–423. doi: 10.1899/07-058.1. - DOI
-
- Strayer D.L. Effects of Alien Species on Freshwater Mollusks in North America. J. N. Am. Benthol. Soc. 1999;18:74–98. doi: 10.2307/1468010. - DOI
-
- Haag W.R. North American Freshwater Mussels: Natural History, Ecology, and Conservation. Cambridge University Press; Cambridge, UK: 2012.
Grants and funding
LinkOut - more resources
Full Text Sources
