. 2024 Sep 5;14(17):2587.
doi: 10.3390/ani14172587.

UID-Dual Transcriptome Sequencing Analysis of the Molecular Interactions between Streptococcus agalactiae ATCC 27956 and Mammary Epithelial Cells

Affiliations

UID-Dual Transcriptome Sequencing Analysis of the Molecular Interactions between Streptococcus agalactiae ATCC 27956 and Mammary Epithelial Cells

Jishang Gong et al. Animals (Basel). .

Abstract

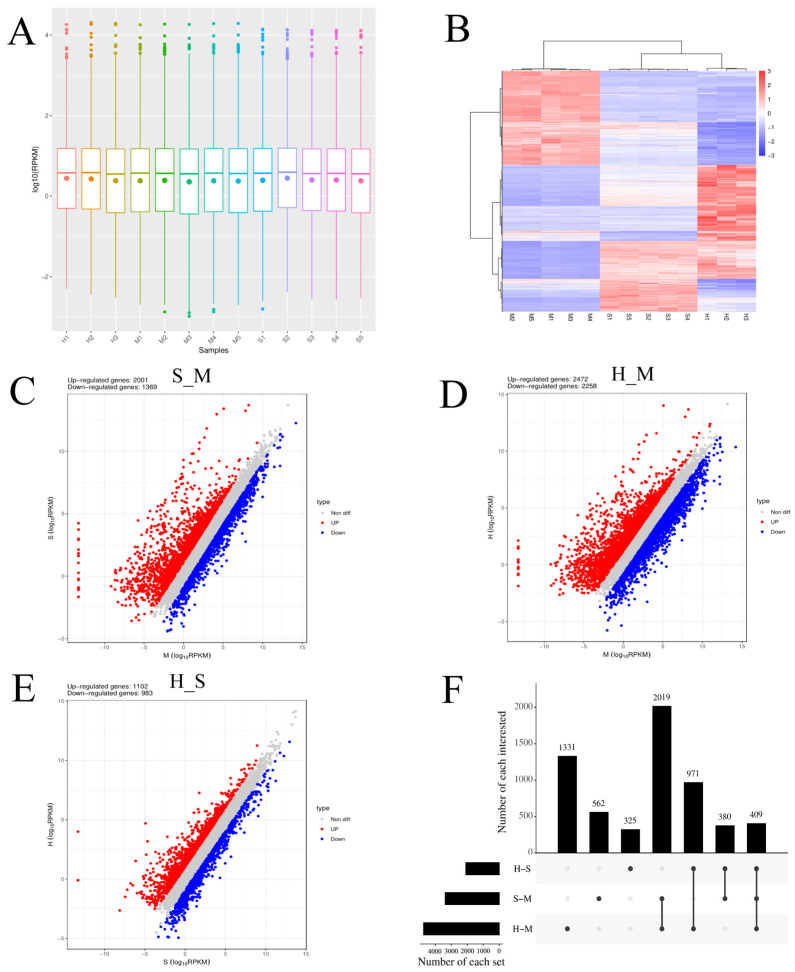
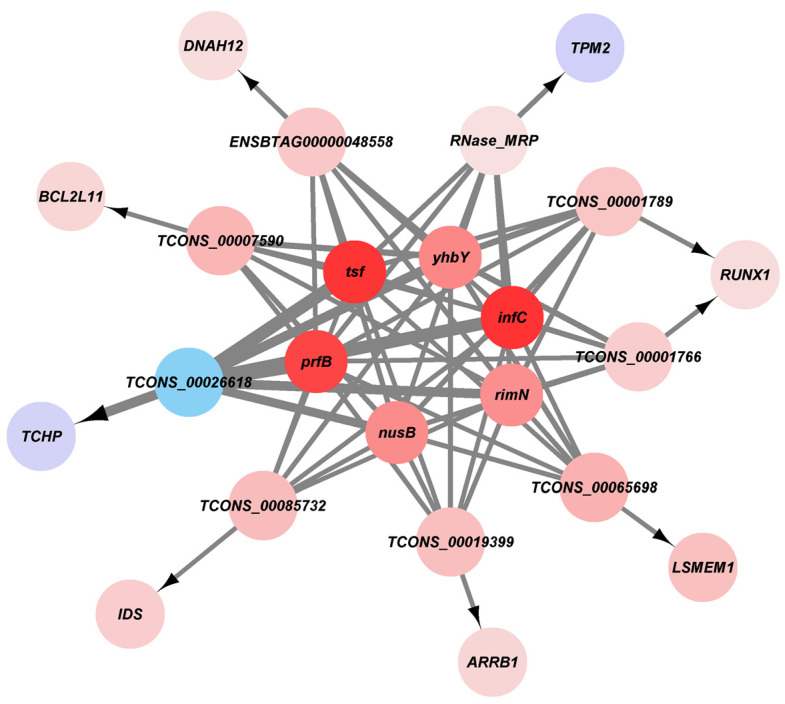
Streptococcus agalactiae ATCC 27956 is a highly contagious Gram-positive bacterium that causes mastitis, has a high infectivity for mammary epithelial cells, and becomes challenging to treat. However, the molecular interactions between it and mammary epithelial cells remain poorly understood. This study analyzed differential gene expression in mammary epithelial cells with varying levels of S. agalactiae infection using UID-Dual transcriptome sequencing and bioinformatics tools. This study identified 211 differentially expressed mRNAs (DEmRNAs) and 452 differentially expressed lncRNAs (DElncRNAs) in host cells, primarily enriched in anti-inflammatory responses, immune responses, and cancer-related processes. Additionally, 854 pathogen differentially expressed mRNAs (pDEmRNAs) were identified, mainly enriched in protein metabolism, gene expression, and biosynthesis processes. Mammary epithelial cells activate pathways, such as the ERK1/2 pathway, to produce reactive oxygen species (ROS) to eliminate bacteria. The bacteria disrupt the host's innate immune mechanisms by interfering with the alternative splicing processes of mammary epithelial cells. Specifically, the bacterial genes of tsf, prfB, and infC can interfere with lncRNAs targeting RUNX1 and BCL2L11 in mammary epithelial cells, affecting the alternative splicing of target genes and altering normal molecular regulation.

Keywords: Streptococcus agalactiae; UID-Dual; mammary epithelial cells; mastitis; transcriptome sequencing.


Conflict of interest statement

The authors declare no conflicts of interest.

Figures

Figure 1
Figure 1
Screening differently expressed mRNAs (DEmRNAs) in S. agalactiae ATCC 27956 infected mammary epithelial cells among the control (n = 5), S. agalactiae—S groups (n = 5), and S. agalactiae—H groups (n = 3). (A) Gene expression level analysis in S_M, H_M, and H_S. The X-axis of the box plot represents the sample name, while the Y-axis represents log10 (RPKM). The box plots for each region correspond to five statistical measures (maximum, upper quartile, median, lower quartile, and minimum values, respectively). (B) Cluster analysis of DEmRNAs in mammary epithelial cells between the control group (M1, M2, M3, M4, and M5), S groups (S1, S2, S3, S4, and S5), and H-treated groups (H1, H2, and H3). Red indicates highly expressed genes, and blue indicates low expressed genes. Each column represents a sample, and each row represents a gene. On the left is the tree diagram of mRNA clustering. The closer the two mRNA branches are, the closer their expression level is. The upper part is the tree diagram of sample clustering, and the bottom is the name of each sample. The closer the two-sample branches are to each other, the closer the expression pattern of all genes in the two samples is and the trend of the more recent gene expression. (CE) Volcano plot of global DEmRNAs in S_M, H_M, and H_S, respectively. Red dots (up) represent significantly upregulated genes (p-values < 0.05, log2(fold-change) > 1); blue dots (down) represent significantly downregulated genes (p-values < 0.05, log2(fold-change) < −1); gray dots represent insignificantly differential expressed genes. (F) Upset map analysis of S_M, H_M, and H_S. The origin and connecting lines of the X-axis represent intersections, while the black bars represent the number of differentially expressed genes in each group. The number of differentially expressed genes at the intersection of each group on the Y-axis.
Figure 2
Figure 2
GO and KEGG analysis of DEmRNAs in S_M, H_M, and H_S. (A) The Y-axis on the left represents GO terms of upregulated genes, including biological process (BP), cellular component (CP), and molecular function (MF). The X-axis indicates different comparison groups. The area of a circle represents the DEG number. Low p-values are shown in the red circle, and high p-values are shown in the blue circle. (B) The Y-axis on the left represents GO terms of downregulated genes, including biological process (BP), cellular component (CP), and molecular function (MF). The X-axis indicates different comparison groups. The area of a circle represents the DEG number. Low p-values are shown in the red circle, and high p-values are shown in the blue circle. (C) The Y-axis on the left represents KEGG pathways, and the X-axis indicates the gene enrichment of each term. The shapes represent different groups. The area of shapes represents DEmRNA numbers.
Figure 3
Figure 3
GO enrichment results of differentially spliced genes in S_M, H_M, and H_S. The Y-axis on the left represents GO terms, including biological process (BP), cellular component (CP), and molecular function (MF), and the X-axis indicates gene enrichment of each term. Low p-values are shown in the red circle, and high p-values are shown in the green circle. The area of a circle represents the DEmRNA number.
Figure 4
Figure 4
The pathways of spliced genes in S_M, H_M, and H_S. The Y-axis on the left represents KEGG pathways, the Y-axis on the right represents the major category to which each pathway belongs, and the X-axis indicates the DEmRNA numbers of each pathway.
Figure 5
Figure 5
Screening DElncRNAs compared between the M group, S group, and H group. (A) Distribution of DElncRNAs in each sample, with the Y-axis representing the number of genes and the X-axis representing different samples; (B) Venn analysis of novel DElncRNAs obtained from four software programs: CNCI, CPC, Pfam, and CPAT. (C) Cluster analysis of DElncRNAs in mammary epithelial cells between the control group (M1, M2, M3, M4, and M5), normally treated groups (S1, S2, S3, S4, and S5), and deeply treated groups (H1, H2, and H3). Red indicates highly expressed genes, and green indicates low expressed genes. Each column represents a sample. (DF) Volcano plot of global DElncRNAs in S_M, H_M, and H_S, respectively. Gradient red dots represent significantly regulated genes (p < 0.05, |log2(fold-change)| > 1); dark green dots represent significantly differential expressed genes.
Figure 6
Figure 6
Prediction of target genes for DElncRNA. The red circle represents lncRNA, and the purple circle represents mRNA. The area of the circle represents the degree of connectivity between genes.
Figure 7
Figure 7
Venn map analysis of DElncRNA target genes, DEmRNA, and AS genes. DEG means differential expression genes; AS means alternative splicing; S_M, H_S, and H_M represent three comparison groups; target lncRNA means three comparative groups targeting mRNA.
Figure 8
Figure 8
Trend analysis of S. agalactiae infection in breast epithelial cells. This series of charts uses Mfuzz to illustrate the dynamic changes in DEmRNAs during pathogen infection. In eight clusters, pink, light blue and blue lines all represent genes with large expression amplitudes. The red area represents genes with similar expression trends. The black line represents the expression trend of the cluster.
Figure 9
Figure 9
Screening and enrichment analysis of pDEmRNAs of S. agalactiae ATCC 27956 normally treated groups (n = 5) compared with S. agalactiae deeply treated groups. (A) Cluster analysis of pDEmRNAs in S. agalactiae between normally treated groups (S1, S2, S3, S4, and S5) and deeply treated groups (H1, H2, and H3). Red indicates highly expressed genes, and blue indicates low expressed genes. Each column represents a sample, and each row represents a gene. On the left is the tree diagram of mRNA clustering. (B) Volcano plot of global pDEmRNAs in S. agalactiae between normally treated groups and deeply treated groups. Red dots (up) represent significantly upregulated genes (p < 0.05, log2(fold-change) > 1); blue dots (down) represent significantly downregulated genes (p < 0.05, log2(fold-change) < −1); gray dots represent insignificantly differential expressed genes. (C) KEGG pathway classified annotation of pDEmRNAs in S. agalactiae. The pathway is exhibited on the left axis, and the area of the circle represents the number of genes listed on the right axis. (D) Annotation of pDEmRNAs using Gene Ontology (GO) in S. agalactiae. The rich factor of mRNAs for each GO annotation is exhibited on the left axis.
Figure 10
Figure 10
Co-expression network of host cell DElncRNA, DEmRNA, and pathogen pDEmRNA. Red indicates upregulation, blue indicates downregulation, and the color intensity represents strength.
Figure 11
Figure 11
The expression levels of candidate genes.

Similar articles

References

    1. Davis S.R., Farr V.C., Copeman P.J., Carruthers V.R., Knight C.H., Stelwagen K. Partitioning of milk accumulation between cisternal and alveolar compartments of the bovine udder: Relationship to production loss during once daily milking. J. Dairy Res. 1998;65:1–8. doi: 10.1017/S0022029997002562. - DOI - PubMed
    1. Kurban D., Roy J.P., Kabera F., Fréchette A., Um M.M., Albaaj A., Rowe S., Godden S., Adkins P.R.F., Middleton J.R., et al. Diagnosing Intramammary Infection: Meta-Analysis and Mapping Review on Frequency and Udder Health Relevance of Microorganism Species Isolated from Bovine Milk Samples. Animals. 2022;12:3288. doi: 10.3390/ani12233288. - DOI - PMC - PubMed
    1. Wang Y., Nan X., Zhao Y., Jiang L., Wang H., Zhang F., Hua D., Liu J., Yao J., Yang L., et al. Dietary Supplementation of Inulin Ameliorates Subclinical Mastitis via Regulation of Rumen Microbial Community and Metabolites in Dairy Cows. Microbiol. Spectr. 2021;9:e0010521. doi: 10.1128/Spectrum.00105-21. - DOI - PMC - PubMed
    1. Hoekstra J., Zomer A.L., Rutten V., Benedictus L., Stegeman A., Spaninks M.P., Bennedsgaard T.W., Biggs A., De Vliegher S., Mateo D.H., et al. Genomic analysis of European bovine Staphylococcus aureus from clinical versus subclinical mastitis. Sci. Rep. 2020;10:18172. doi: 10.1038/s41598-020-75179-2. - DOI - PMC - PubMed
    1. Khan M.Z., Wang J., Ma Y., Chen T., Ma M., Ullah Q., Khan I.M., Khan A., Cao Z., Liu S. Genetic polymorphisms in immune- and inflammation-associated genes and their association with bovine mastitis resistance/susceptibility. Front. Immunol. 2023;14:1082144. doi: 10.3389/fimmu.2023.1082144. - DOI - PMC - PubMed

LinkOut - more resources