. 2024 Aug 23;16(17):2929.
doi: 10.3390/cancers16172929.

Circulating Multiple Myeloma Cells (CMMCs) as Prognostic and Predictive Markers in Multiple Myeloma and Smouldering MM Patients

Affiliations

Circulating Multiple Myeloma Cells (CMMCs) as Prognostic and Predictive Markers in Multiple Myeloma and Smouldering MM Patients

Ilaria Vigliotta et al. Cancers (Basel). .

Abstract

In recent years, liquid biopsy has emerged as a promising alternative to the bone marrow (BM) examination, since it is a minimally invasive technique allowing serial monitoring. Circulating multiple myeloma cells (CMMCs) enumerated using CELLSEARCH® were correlated with patients' prognosis and measured under treatment to assess their role in monitoring disease dynamics. Forty-four MM and seven smouldering MM (SMM) patients were studied. The CMMC medians at diagnosis were 349 (1 to 39,940) and 327 (range 22-2463) for MM and SMM, respectively. In the MM patients, the CMMC count was correlated with serum albumin, calcium, β2-microglobulin, and monoclonal components (p < 0.04). Under therapy, the CMMCs were consistently detectable in 15/40 patients (coMMstant = 1) and were undetectable or decreasing in 25/40 patients (coMMstant = 0). High-quality response rates were lower in the coMMstant = 1 group (p = 0.04), with a 7.8-fold higher risk of death (p = 0.039), suggesting that continuous CMMC release is correlated with poor responses. In four MM patients, a single-cell DNA sequencing analysis on residual CMMCs confirmed the genomic pattern of the aberrations observed in the BM samples, also highlighting the presence of emerging clones. The CMMC kinetics during treatment were used to separate the patients into two subgroups based on the coMMstant index, with different responses and survival probabilities, providing evidence that CMMC persistence is associated with a poor disease course.

Keywords: circulating tumor cells; liquid biopsy; multiple myeloma; single-cell analysis; smouldering multiple myeloma.


Conflict of interest statement

M.T., P.T., M.G., A.F., and N.M. are employees of Menarini Silicon Biosystems SpA, manufacturer of CELLSEARCH, DEPArray and Ampli1; P.T., M.G., A.F., and N.M. are co-inventors (not receiving royalties) on various patents assigned to Menarini Silicon Biosystems, related to the aforementioned technologies.

Figures

Figure 1
Figure 1
KruskalWallis analyses panel (CMMC count expressed as logarithm value). (A) CMMC counts in MM (red) and SMM (blue) patients at diagnosis; (B) correlation between CMMC count and amplification (amp) of chromosome 9 in SMM patients, with SMM patients carrying amp9 displayed in blue; (C) correlation between CMMC counts in MM patients and serum beta-2 microglobulin (β2M) levels; (D) correlation between CMMC counts in MM patients and c-reactive protein (CRP); (E) correlation between CMMC counts in MM patients at baseline vs. ISS III (in orange ISS III-patients); (F) correlation between CMMC counts in MM patients and chromosome 5q amplification.
Figure 1
Figure 1
KruskalWallis analyses panel (CMMC count expressed as logarithm value). (A) CMMC counts in MM (red) and SMM (blue) patients at diagnosis; (B) correlation between CMMC count and amplification (amp) of chromosome 9 in SMM patients, with SMM patients carrying amp9 displayed in blue; (C) correlation between CMMC counts in MM patients and serum beta-2 microglobulin (β2M) levels; (D) correlation between CMMC counts in MM patients and c-reactive protein (CRP); (E) correlation between CMMC counts in MM patients at baseline vs. ISS III (in orange ISS III-patients); (F) correlation between CMMC counts in MM patients and chromosome 5q amplification.
Figure 2
Figure 2
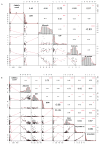
Graphical correlation matrix (Scatterplot matrix, Pearson’s test). The absolute correlation between pairs of variables is displayed in the upper panels, with the font size proportional to the absolute value of the correlation. Statistical significances are highlighted with * (* = 0.01; ** = 0.001; *** = 0.0001). Along the diagonal are presented the histograms for each variable, and the LOESS (locally estimated scatterplot smoothing) curves are displayed in the lower panels. (A) Correlation between CMMC count and major biochemical markers’ continuous variables at diagnosis, and (B) during post-treatment pre-maintenance phase.
Figure 3
Figure 3
Graphical correlation matrix (Scatterplot matrix, Spearman’s test). The upper panels show the absolute correlation between pairs of variables, with the font size corresponding to the correlation’s absolute value. The histograms for each variable are shown along the diagonal, and the lower panels show the LOESS curves. (A) Correlation between CMMC counts and major biochemical markers’ continuous variables at diagnosis, and (B) during post-treatment pre-maintenance phase. Statistical significances are highlighted with * (* = 0.01; ** = 0.001; *** = 0.0001).
Figure 4
Figure 4
Paired analyses of MRDs and CMMCs (i.e., performed at the same time) at different time-points (m = months) for each MM patient. MRD measures are displayed as squares, while CMMCs enumerations are shown as circles. MRD and CMMC levels are explained in the legend.
Figure 5
Figure 5
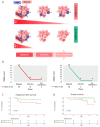
Patient clustering by CMMCs counted throughout treatment monitoring. (A) A graphical display of the two different CMMC dynamics in the coMMstant index. Patients were divided into two clusters by their CMMC numbers: coMMstant = 1 (in red) patients, who consistently presented CMMCs during induction and after ASCT, and coMMstant = 0 (in green), who were not characterized by CMMCs during follow-up, or whose number increased or decreased over time, show at least a count = 0 within the first two enumerations. Cell design was performed by BioRender® (https://app.biorender.com/). (B) Examples of a coMMstant = 1 patient (in red, right) and a coMMstant = 0 patient (in green, left) with their CMMCs dynamics through disease monitoring: at diagnosis, during induction, and in pre-maintenance. Survival probability curves between coMMstant = 1 and coMMstant = 0 groups: (C) Progression-free survival according to coMMstant index (months), and (D) overall survival according to coMMstant index (months).
Figure 6
Figure 6
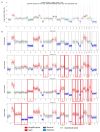
Single-cell genomic analysis of CNA profiles. (A) BM-PC CNA profile; (B) CMMC CNA profiles of four single cells. In red are highlighted gains and amplifications, and in blue are deletions. Gray symbolizes normal status. CNAs differing from single cells to BM profiles are denoted with a red box.

References

    1. An G., Qin X., Acharya C., Xu Y., Deng S., Shi L., Zang M., Sui W., Yi S., Li Z., et al. Multiple myeloma patients with low proportion of circulating plasma cells had similar survival with primary plasma cell leukemia patients. Ann. Hematol. 2015;94:257–264. doi: 10.1007/s00277-014-2211-0. - DOI - PubMed
    1. Palumbo A., Avet-Loiseau H., Oliva S., Lokhorst H.M., Goldschmidt H., Rosinol L., Richardson P., Caltagirone S., Lahuerta J.J., Facon T., et al. Revised International Staging System for Multiple Myeloma: A Report from International Myeloma Working Group. J. Clin. Oncol. 2015;33:2863–2869. doi: 10.1200/JCO.2015.61.2267. - DOI - PMC - PubMed
    1. Gonsalves W.I., Jevremovic D., Nandakumar B., Dispenzieri A., Buadi F.K., Dingli D., Lacy M.Q., Hayman S.R., Kapoor P., Leung N., et al. Enhancing the R-ISS classification of newly diagnosed multiple myeloma by quantifying circulating clonal plasma cells. Am. J. Hematol. 2020;95:310–315. doi: 10.1002/ajh.25709. - DOI - PMC - PubMed
    1. Sanoja-Flores L., Flores-Montero J., Pérez-Andrés M., Puig N., Orfao A. Detection of Circulating Tumor Plasma Cells in Monoclonal Gammopathies: Methods, Pathogenic Role, and Clinical Implications. Cancers. 2020;12:1499. doi: 10.3390/cancers12061499. - DOI - PMC - PubMed
    1. Garcés J.J., Cedena M.T., Puig N., Burgos L., Perez J.J., Cordon L., Flores-Montero J., Sanoja-Flores L., Calasanz M.J., Ortiol A., et al. Circulating Tumor Cells for the Staging of Patients with Newly Diagnosed Transplant-Eligible Multiple Myeloma. J. Clin. Oncol. 2022;40:3151–3161. doi: 10.1200/JCO.21.01365. - DOI - PubMed

LinkOut - more resources