. 2024 Aug 24;16(17):2949.
doi: 10.3390/cancers16172949.

Genome-Wide CRISPR Screen Identifies KEAP1 Perturbation as a Vulnerability of ARID1A-Deficient Cells

Affiliations

Genome-Wide CRISPR Screen Identifies KEAP1 Perturbation as a Vulnerability of ARID1A-Deficient Cells

Louis-Alexandre Fournier et al. Cancers (Basel). .

Abstract

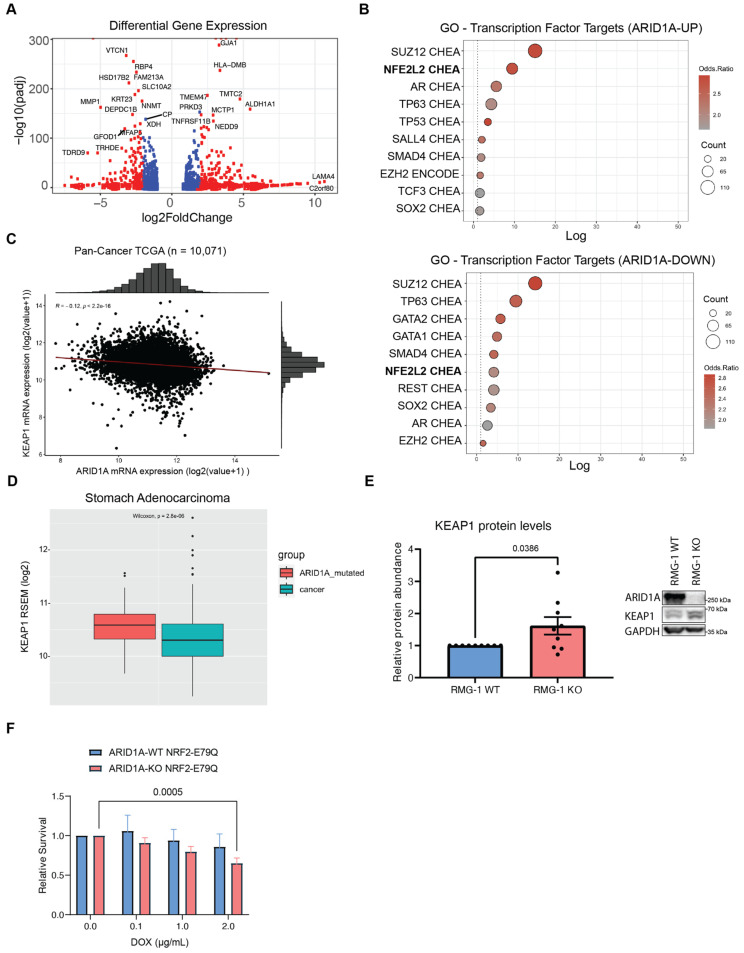
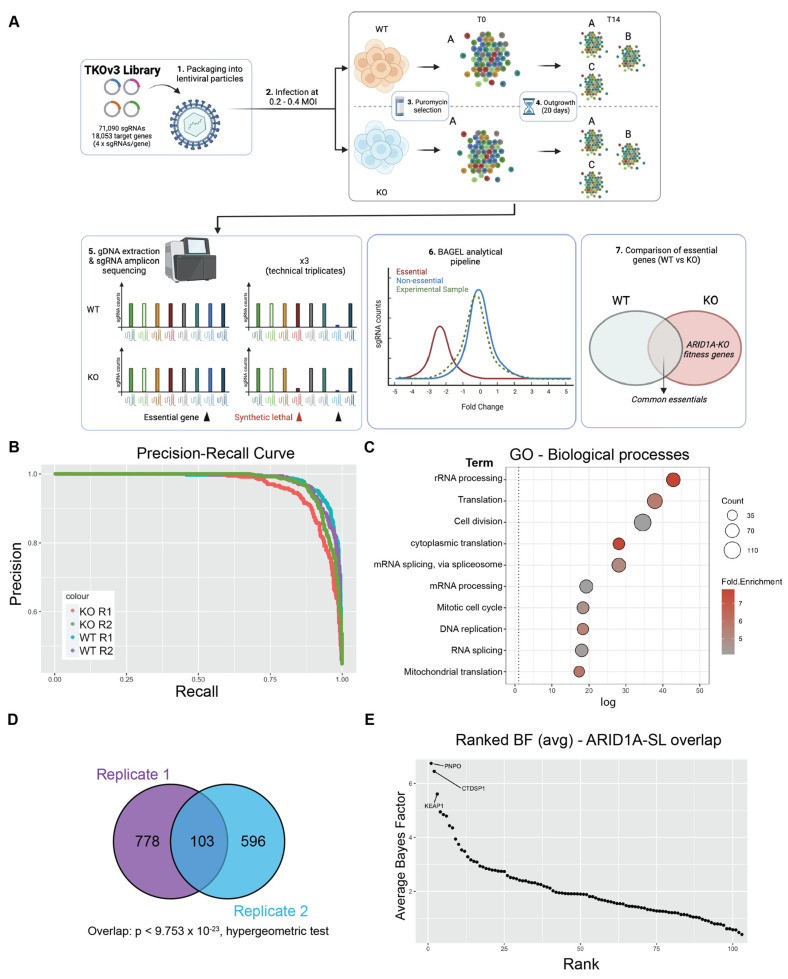
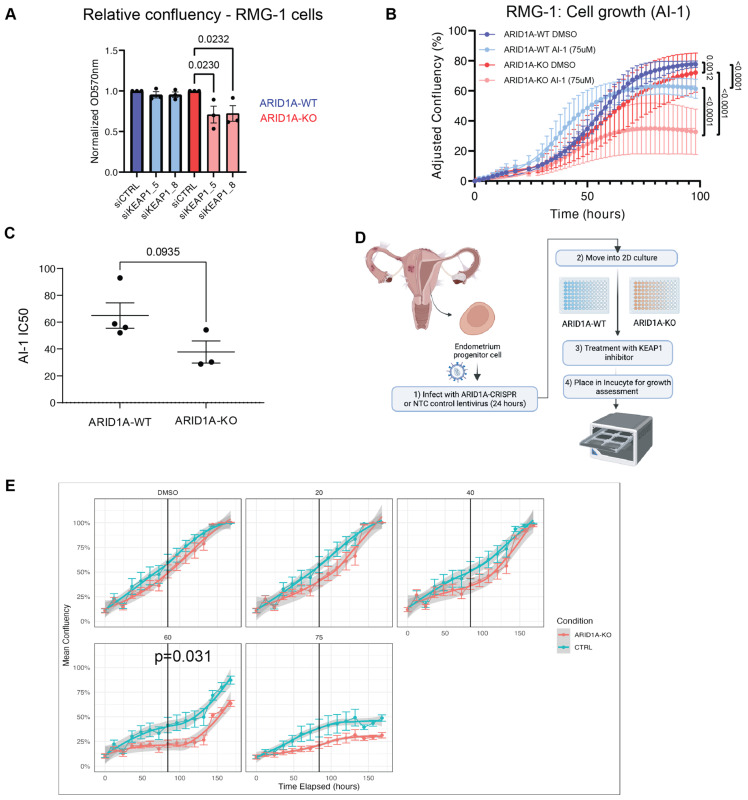
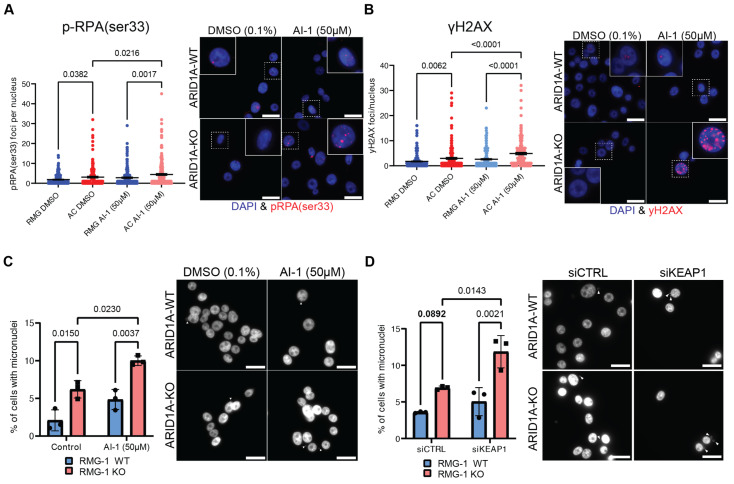
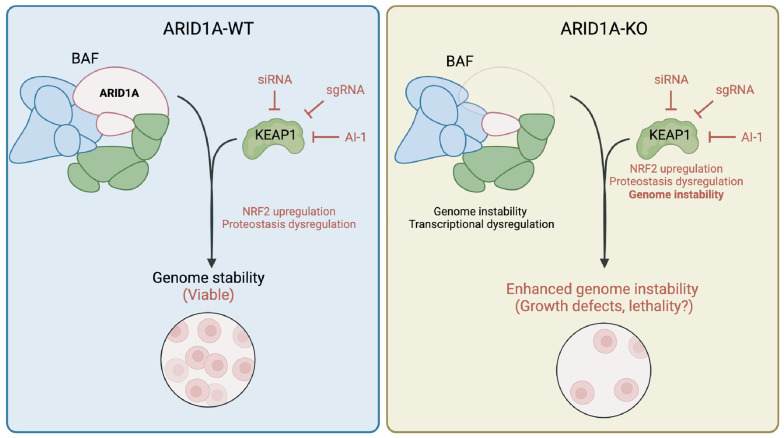
ARID1A is the core DNA-binding subunit of the BAF chromatin remodeling complex and is mutated in about 8% of all cancers. The frequency of ARID1A loss varies between cancer subtypes, with clear cell ovarian carcinoma (CCOC) presenting the highest incidence at > 50% of cases. Despite a growing understanding of the consequences of ARID1A loss in cancer, there remains limited targeted therapeutic options for ARID1A-deficient cancers. Using a genome-wide CRISPR screening approach, we identify KEAP1 as a genetic dependency of ARID1A in CCOC. Depletion or chemical perturbation of KEAP1 results in selective growth inhibition of ARID1A-KO cell lines and edited primary endometrial epithelial cells. While we confirm that KEAP1-NRF2 signalling is dysregulated in ARID1A-KO cells, we suggest that this synthetic lethality is not due to aberrant NRF2 signalling. Rather, we find that KEAP1 perturbation exacerbates genome instability phenotypes associated with ARID1A deficiency. Together, our findings identify a potentially novel synthetic lethal interaction of ARID1A-deficient cells.

Keywords: ARID1A; CRISPR screening; KEAP1; synthetic lethality.


Conflict of interest statement

LAF is a member of the Office of the Canada Chief Science Advisor Youth Council (CSA-YC). PCS is CEO of Arrowsmith Genetics Inc.

Figures

Figure 3
Figure 3
ARID1A-KO sensitivity to KEAP1 depletion is only partly due to dysregulation of NRF2 (A) Volcano plot of differentially expressed genes in ARID1A-KO RMG-1 cells from RNA-seq dataset published in Wu et al. [22] (blue dots if padj < 0.01, red dots if log2FC > 1 or log2FC < −1 AND padj < 0.01). (B) Top 10 enriched transcription factor target genes identified from the ARID1A-UP (above) and ARID1A-DOWN (below) regulated genes using the ENCODE [50] and ChEA [51] datasets (EnrichR [52]; p < 0.05 with Benjamini-Hochberg correction). (C) Quantification of KEAP1 and ARID1A mRNA levels (RSEM, log2) from pan-cancer TCGA data (n = 10,071) showing a negative correlation between the two genes. (D) Quantification of KEAP1 mRNA levels (RSEM, log2) from TCGA data (stomach adenocarcinoma—STAD) showing higher KEAP1 levels in ARID1A-mutated patient samples (n = 90) compared to WT (n = 336) (box limits indicate 25% and 75% over median, Wilcoxon test, p = 2.8 × 10⁻⁶). (E) Left: Quantification of KEAP1 protein levels from western blot data showing higher levels in ARID1A-KO RMG-1 cells. KEAP1 intensity was normalized to respective GAPDH loading control, and then to ARID1A-WT (data from 9 from independent samples, mean ± SEM, t test, significant p-values displayed on graph). Right: Representative western blot image. (F) Quantification of crystal violet viability assay showing that ARID1A-KO RMG-1 cells exhibit sensitivity to NRF2E79Q expression induced by doxycycline (mean ± SEM, ANOVA, n = 3, significant p-values displayed on graph).
Figure 1
Figure 1
Genome-wide CRISPR screen identifies KEAP1 as a synthetic lethal partner of ARID1A. (A) Schematic of CRISPR screening workflow with the TKOv3 library. (B) Precision-Recall curve assessing CRISPR screen performance of individual replicates (values obtained from BAGEL2 algorithm, Supplementary Table S1.5-6). (C) Top 10 enriched Biological Processes GO terms identified using David v 6.8 (p < 0.05, with FDR correction) for the ARID1A-KO fitness genes identified by either of our CRISPR screens (n = 1484 genes, Supplementary Table S1.7). (D) Overlap of ARID1A-SL hits from both biological replicates of the CRISPR screen. (E) Ranked ARID1A-KO specific hits (average BF from both biological replicates, Supplementary Table S1.8). The top 3 hits are labeled on the graph. Panel (A) was created using Biorender.
Figure 2
Figure 2
ARID1A-KO cells are sensitive to KEAP1 depletion by siRNA and small molecule perturbation. (A) Quantification of crystal violet viability assays in RMG-1 cells (mean ± SEM, one-way ANOVA, n = 3, statistically significant p-values are displayed on graph). (B) ARID1A-KO RMG-1 cells grow slower than ARID1A-WT when treated with 75 µM AI-1 as measured by IncuCyte S3 imaging system. Relative confluency presented as the growth from initial time point. Error bars represent SEM of averaged triplicated wells from 3 independent experiments. P values obtained from extra sum-of-squares F test on calculated logistic growth rate are indicated on graph. (C) ARID1A-KO CCOC cells present lower IC50 values to AI-1 than ARID1-WT cells (t-test, mean ± SEM). IC50 values were obtained from dose-response curves presented in Supplementary Figure S2F–H (n = 3). (D) Patient-derived endometrium progenitor cell workflow. Normal endometrial tissue was processed and put in 2D culture to expand the progenitor cell population before CRISPR and AI-1 treatments (see Section 4). (E) Average proliferation curves of three primary endometrial epithelial cell cultures transduced with non-targeting (NTC5) or sgARID1A (ARID1A-KO) lentivirus and treated with AI-1 at the indicated concentrations. Technical quadruplicates from each patient were normalized and combined. p-value was determined at the midpoint for 60 µM AI-1 (Welch’s t-test). CRISPR knockdown western blots, and individual patient derived growth curves are shown in Supplementary Figure S2E–H. Panel (D) was created using Biorender.
Figure 4
Figure 4
KEAP1 perturbation exacerbates genome instability phenotypes of ARID1A-KO cells (A,B). Quantification (left) and representative images (right) of immunofluorescence experiment showing AI-1 (50 µM) induces higher rates of p-RPAser33 (A) or γH2AX (B) foci formation in ARID1A-KO RMG-1 cells (mean ± SEM, ANOVA, n = 3, significant p-values displayed on graph). (C,D) Quantification (left) and representative images (right) showing that ARID1A-KO RMG-1 cells accumulate higher levels of micronuclei compared to WT when treated with 50 µM AI-1 (C) or siKEAP1 (D) (mean ± SEM, ANOVA, n = 3, significant p-values displayed on graph). White arrows highlighting micronuclei. In A through D, a 20 µm scale bar is show in the lower right.
Figure 5
Figure 5
Sensitivity of ARID1A-KO cells to KEAP1 perturbation is conserved in endometrium progenitor-derived organoid model. Model of ARID1A-KEAP1 synthetic lethality. Perturbation of KEAP1 dysregulates normal NRF2 signalling and proteostasis, which remains viable in normal cells. Perturbation of KEAP1 in ARID1A-KO cells specifically enhances genome instability phenotypes, resulting in growth defects. This figure was created using Biorender.

Similar articles

Cited by

References

    1. Wiegand K.C., Shah S.P., Al-Agha O.M., Zhao Y., Tse K., Zeng T., Senz J., McConechy M.K., Anglesio M.S., Kalloger S.E., et al. ARID1A Mutations in Endometriosis-Associated Ovarian Carcinomas. N. Engl. J. Med. 2010;363:1532–1543. doi: 10.1056/NEJMoa1008433. - DOI - PMC - PubMed
    1. Jones S., Wang T.-L., Shih I.-M., Mao T.-L., Nakayama K., Roden R., Glas R., Slamon D., Diaz L.A., Vogelstein B., et al. Frequent Mutations of Chromatin Remodeling Gene ARID1A in Ovarian Clear Cell Carcinoma. Science. 2010;330:228–231. doi: 10.1126/science.1196333. - DOI - PMC - PubMed
    1. Ashizawa M., Saito M., Min A.K.T., Ujiie D., Saito K., Sato T., Kikuchi T., Okayama H., Fujita S., Endo H., et al. Prognostic Role of ARID1A Negative Expression in Gastric Cancer. Sci. Rep. 2019;9:6769. doi: 10.1038/s41598-019-43293-5. - DOI - PMC - PubMed
    1. Wang D., Chen Y., Pan K., Wang W., Chen S., Chen J., Zhao J., Lv L., Pan Q., Li Y., et al. Decreased Expression of the ARID1A Gene Is Associated with Poor Prognosis in Primary Gastric Cancer. PLoS ONE. 2012;7:e40364. doi: 10.1371/journal.pone.0040364. - DOI - PMC - PubMed
    1. Zhu Y.P., Sheng L.L., Wu J., Yang M., Cheng X.F., Wu N.N., Ye X.B., Cai J., Wang L., Shen Q., et al. Loss of ARID1A Expression Is Associated with Poor Prognosis in Patients with Gastric Cancer. Hum. Pathol. 2018;78:28–35. doi: 10.1016/j.humpath.2018.04.003. - DOI - PubMed

LinkOut - more resources