. 2024 Aug 27;13(17):1435.
doi: 10.3390/cells13171435.

Identification and Characterization of Multiple Paneth Cell Types in the Mouse Small Intestine

Affiliations

Identification and Characterization of Multiple Paneth Cell Types in the Mouse Small Intestine

Steven Timmermans et al. Cells. .

Abstract

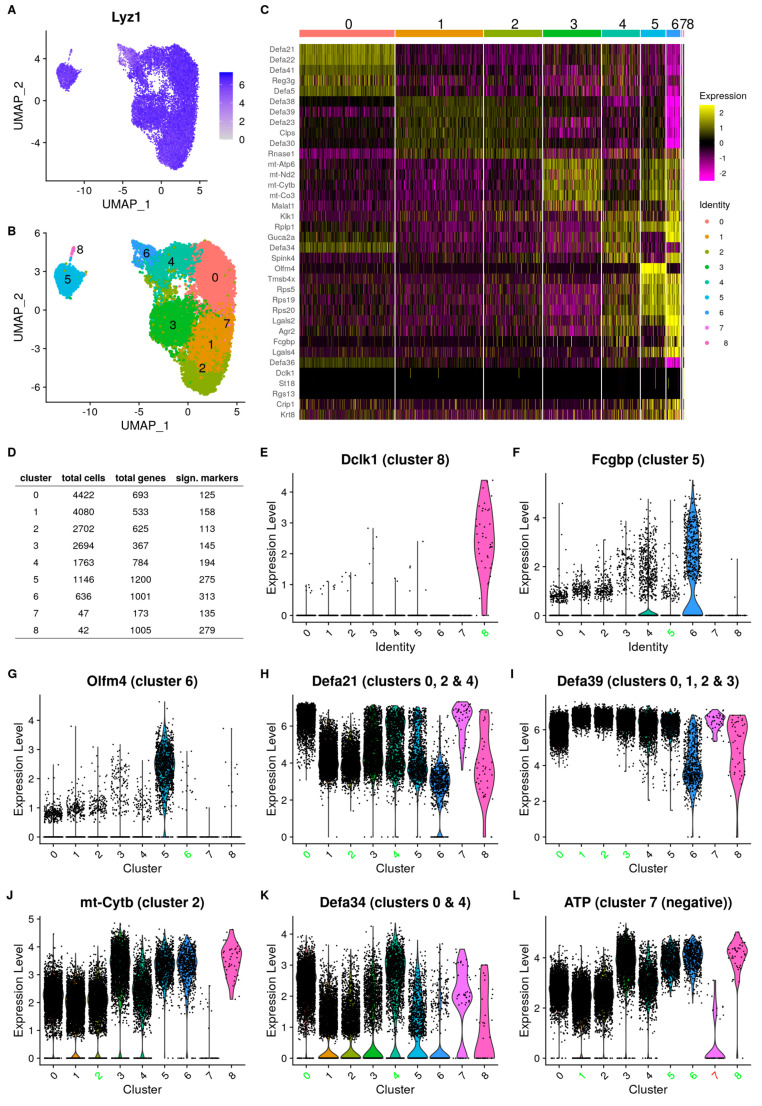
The small intestinal crypts harbor secretory Paneth cells (PCs) which express bactericidal peptides that are crucial for maintaining intestinal homeostasis. Considering the diverse environmental conditions throughout the course of the small intestine, multiple subtypes of PCs are expected to exist. We applied single-cell RNA-sequencing of PCs combined with deep bulk RNA-sequencing on PC populations of different small intestinal locations and discovered several expression-based PC clusters. Some of these are discrete and resemble tuft cell-like PCs, goblet cell (GC)-like PCs, PCs expressing stem cell markers, and atypical PCs. Other clusters are less discrete but appear to be derived from different locations along the intestinal tract and have environment-dictated functions such as food digestion and antimicrobial peptide production. A comprehensive spatial analysis using Resolve Bioscience was conducted, leading to the identification of different PC's transcriptomic identities along the different compartments of the intestine, but not between PCs in the crypts themselves.

Keywords: Paneth cells; single-cell RNA-seq; small intestine.


Conflict of interest statement

The authors declare that they have no conflicts of interest.

Figures

Figure 1
Figure 1
Single-cell transcriptomics analysis on purified PCs. (A): Expression plot of Lyz1 showing that all cells express this typical PC marker gene. (B): Uniform manifold approximation and projection (UMAP) of the scRNA-seq dataset, colored according to Seurat clusters that are assigned by Leiden clustering. In total, 9 clusters were identified. (C): Heatmap of the top 5 positive markers per clusters (some markers are shared between clusters). (D): Table showing the average numbers of genes detected per cluster and the number of those identified as cluster markers. Some clusters are defined by the number of detected genes in addition to cluster-specific markers (5, 7, and 8). (EL): Violin plots of selected marker genes (Dclk1, Fcgbp, Olfm4, Defa21, Defa39, mt-Cytb, Defa34, and Atp) depicting the log2-scaled expression levels and the number of cells expressing each marker within each cluster. Red or green cluster numbers indicate in which cluster the markers are downregulated or upregulated, respectively.
Figure 2
Figure 2
Markers identified by Haber et al. (AF): Most enterocyte marker genes (Apoa4, Fabp1, Tmigd1, Fabp6, and Slc51b) are expressed very little and in only very few cells, with some exceptions (Apoc2, C). (G,H): Goblet cell markers (Agr2 and Klkl1) can be found in our dataset and are most highly expressed in cluster 5. (I): Goblet cell marker Zg16 is only found in a few cells, with the majority and the highest expression levels observed in cluster 5. (JL): Tuft cell markers (Hck, Sh2d6, and Fyb) described by Haber et al. are indeed expressed in the cells from cluster 8 of our dataset. All clusters express PC markers as well.
Figure 3
Figure 3
PC bulk RNA-seq analysis across regions of the small intestine. (A): Workflow of the bulk RNA-seq experiment. (BH): Expression profiles of groups 1–7. (I): Top 5 differentially expressed pathways for each group as found via Metascape analysis (the expression profiles of the different groups can be roughly placed along the small intestine). The graph under the table shows a schematic representation of the most important proximal-to-distal gradients in the small intestine. Whiskers indicate variability outside the upper and lower quartiles. Outliers, which are data points that fall outside this range, are plotted as individual dots aligned with the whiskers.
Figure 4
Figure 4
Integration of the scRNA-seq and bulk RNA-seq data. (A): Correlation matrix between scRNA-seq clusters and bulk RNA-seq (based on a pseudo-bulk expression dataset). (B): scRNA-seq UMAP plot with all subpopulations annotated based on the scRNA-seq marker and region bulk RNA-seq data. (C): Dotplot showing the scRNA-seq expression of the selected marker genes, described in the following panels. (DH): Expression profile of single-cell marker genes in the bulk RNA-seq, Dclk1 (D), Fcgbp and Tff3 (E), Olfm4 (F), Mt-cytb (G), and Defa21 and Rnase1 (H).
Figure 5
Figure 5
Resolve molecular cartography. (A): Workflow of the Resolve spatial transcriptomics experiment. (B,C): Average abundance of Rnase1 and Olfm4 in the Resolve samples (in counts per million) showing a decreasing expression gradient along the small intestine. (DF): Markers found in the crypts of the duodenum (D), jejunum (E), and ileum (F). Yellow: Rnase1, red: Olfm4, blue and green: PC markers (Hapb2, Nupr1), purple: Fcgbp, white: Dclk1. A color code legend is added above panel (D). Scalebar 20 µm. PC marker signals are strongest in ileum, whereas Olfm4 and Rnase1 exhibit weaker signals. The GC marker Fcgbp can also, rarely, be found in crypts where the signal co-localizes with Olfm4/Hapb2/Nupr1. Dclk1-positive cells are detected in the crypts in close proximity with Olfm4/Hapb2/Nupr1. (G): Cellpose nuclei segmentation on duodenum region 1. (H): Leiden clustering of duodenum region 1. (I): Overlap of the biological replicates of the duodenum to search for batch effects. The perfect overlap indicates the absence of batch effects. (J): Localizing the PCs (2—yellow) and non-Paneth cells (1—black) within a specific region of the duodenum. The provided image is a representative subset of this region. Full images, as well as images of all other samples, can be found in the supplemental data repository Figshare (10.6084/m9.figshare.25999150). (K): A zoomed-in view of the figure shown in panel J, focusing on the region with x-coordinates [540;1410], containing 2 crypts and clearly showing the presence of PCs within these crypts. D: duodenum, J: jejunum, and I: Ileum.
Figure 6
Figure 6
Resolve cell-based analysis. (AC): Leiden clustering of the merged duodenum samples (A), merged jejunum samples (B), and merged ileum samples (C). (DF): Marker expression z-scores for markers of PCs (Nupr1, Habp2, Rnase1, and Wnt3), immature cells (Olfm4), GCs (Fcgbp), and tuft cells (Dclk1) in duodenum (D), jejunum (E), and ileum (F). (GI): PCs, Olfm4-positive cells, tuft cells, and GCs in the duodenum (G), jejunum (H), and ileum (I).

Similar articles

Cited by

References

    1. Haegebarth A., Clevers H. Wnt signaling, Lgr5, and stem cells in the intestine and skin. Am. J. Pathol. 2009;174:715–721. doi: 10.2353/ajpath.2009.080758. - DOI - PMC - PubMed
    1. Sato T., van Es J.H., Snippert H.J., Stange D.E., Vries R.G., van den Born M., Barker N., Shroyer N.F., van de Wetering M., Clevers H. Paneth cells constitute the niche for Lgr5 stem cells in intestinal crypts. Nature. 2011;469:415–418. doi: 10.1038/nature09637. - DOI - PMC - PubMed
    1. Van Der Flier L.G., Clevers H. Stem cells, self-renewal, and differentiation in the intestinal epithelium. Annu. Rev. Physiol. 2009;71:241–260. doi: 10.1146/annurev.physiol.010908.163145. - DOI - PubMed
    1. Sender R., Fuchs S., Milo R. Revised Estimates for the Number of Human and Bacteria Cells in the Body. PLoS Biol. 2016;14:1–14. doi: 10.1371/journal.pbio.1002533. - DOI - PMC - PubMed
    1. Yersin S., Vonaesch P. Small intestinal microbiota: From taxonomic composition to metabolism. Trends Microbiol. 2024. Online ahead of print . - DOI - PubMed

Publication types