. 2024 Aug 30;13(17):1458.
doi: 10.3390/cells13171458.

Immunophenotyping of Peripheral Blood Cells in Patients with Chronic Lymphocytic Leukemia Treated with Ibrutinib

Affiliations

Immunophenotyping of Peripheral Blood Cells in Patients with Chronic Lymphocytic Leukemia Treated with Ibrutinib

Pierre Stéphan et al. Cells. .

Abstract

Chronic lymphocytic leukemia (CLL) is a B-cell-derived hematologic malignancy whose progression depends on active B-cell receptor (BCR) signaling. Despite the spectacular efficacy of Ibrutinib, an irreversible inhibitor of Bruton tyrosine kinase (BTK), resistance can develop in CLL patients, and alternative therapeutic strategies are therefore required. Cancer immunotherapy has revolutionized cancer care and may be an attractive approach in this context. We speculated that characterizing the immune responses of CLL patients may highlight putative immunotherapeutic targets. Here, we used high-dimensional spectral flow cytometry to compare the distribution and phenotype of non-B-cell immune populations in the circulating blood of CLL patients treated with Ibrutinib displaying a complete response or secondary progression. Although no drastic changes were observed in the composition of their immune subsets, the Ibrutinib-resistant group showed increased cycling of CD8+ T cells, leading to their overabundance at the expense of dendritic cells. In addition, the expression of 11 different surface checkpoints was similar regardless of response status. Together, this suggests that CLL relapse upon Ibrutinib treatment may not lead to major alterations in the peripheral immune response.

Keywords: chronic lymphocytic leukemia; immunotherapy; onco-immunology; spectral flow cytometry.


Conflict of interest statement

The authors declare no conflicts of interest related to this study.

Figures

Figure 1
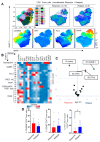
Figure 1
Immune subsets in CLL patients under Ibrutinib therapy. Samples were stained for FACS and analyzed using unsupervised clustering (AC) and traditional supervised analyses (D,E) after manual gating on, B-cell-depleted live cells. (A) Uniform Manifold Approximation and Projection (UMAP) visualization, FlowSOM distribution of clusters and projection of selected markers in concatenated samples. (B) Heatmap showing hierarchical clustering and expression of indicated markers in FlowSOM clusters. (C) Volcano plot showing differential cluster enrichment. (D) Proportion of immune subsets using a supervised gating strategy. CD4+ T cells: CD3+TCRγδCD4+CD8; CD8+ T cells: CD3+TCRγδCD4CD8+; gd T cells: CD3+TCRγδ+; NK cells: CD3CD56+CD7+; DCs: CD3CD11c+CD7; monocytes/macrophages: CD3CD11cCD163+. (E) Proportion of proliferating Ki67+ cells across cell populations. Means +/− SEM are shown; each dot represents a sample. Mann–Whitney tests were used. * p < 0.05, ** p < 0.005.
Figure 2
Figure 2
Phenotype of CD8+ T cells. (A) UMAP visualization, FlowSOM distribution of clusters and projection of selected markers in concatenated samples following manual gating on live CD8+ T cells. (B) Heatmap showing hierarchical clustering and expression of indicated markers in FlowSOM clusters. (C) Volcano plot showing differential cluster enrichment (und.: undefined). (D,E) Expression of the indicated markers (D) and Boolean analysis of inhibitory-checkpoint-expressing cells (E) upon manual gating. Means +/− SEM are shown; each dot represents a sample. Mann–Whitney tests were used. No statistical difference was detected. (FH) Time-dependent impact of Ibrutinib therapy on the expression of PD-1, CD39 and LAG-3. Linear regression slopes, 95% confidence areas and p-values are shown.
Figure 3
Figure 3
Analysis of CD4+ Tconv cells. (A) UMAP visualization, FlowSOM distribution of clusters and projection of selected markers in concatenated samples following manual gating on live CD4+Foxp3 Tconv cells. (B) Heatmap showing hierarchical clustering and expression of indicated markers in FlowSOM clusters. (C) Volcano plot showing differential cluster enrichment. (D) Expression of the indicated markers upon manual gating. Means +/− SEM are shown; each dot represents a sample. Mann–Whitney tests were used. * p < 0.05.
Figure 4
Figure 4
Analysis of Treg cells. (A) Proportion of Foxp3+ regulatory T cells (Treg cells) within CD4+ T cells following manual gating. (B) UMAP visualization, FlowSOM distribution of clusters and projection of selected markers in concatenated samples following manual gating on live Treg cells. (C) Heatmap showing hierarchical clustering and expression of indicated markers in FlowSOM clusters. (D) Volcano plot showing differential cluster enrichment. (E) Proportion of naive Treg cells upon manual gating. Means +/− SEM are shown; each dot represents a sample. Mann–Whitney tests were used.
Figure 5
Figure 5
Analysis of NK cells. (A) UMAP visualization, FlowSOM distribution of clusters and projection of selected markers in concatenated samples following manual gating on live CD7+CD56+ NK cells. (B) Heatmap showing hierarchical clustering and expression of indicated markers in FlowSOM clusters. (C) Volcano plot showing differential cluster enrichment. (D) Expression of the indicated markers upon manual gating. Means +/− SEM are shown; each dot represents a sample. Mann–Whitney tests were used. No statistical difference was detected.
Figure 6
Figure 6
Expression patterns of checkpoint receptors in immune subsets. Proportion of checkpoint-expressing cells in different cell subsets following manual gating is shown as mean +/− SEM. Two-way ANOVA tests were used. * p < 0.05, ** p < 0.005.

References

    1. Ribas A., Wolchok J.D. Cancer immunotherapy using checkpoint blockade. Science. 2018;359:1350–1355. doi: 10.1126/science.aar4060. - DOI - PMC - PubMed
    1. Chiorazzi N., Rai K.R., Ferrarini M. Chronic lymphocytic leukemia. N. Engl. J. Med. 2005;352:804–815. doi: 10.1056/NEJMra041720. - DOI - PubMed
    1. Arruga F., Gyau B.B., Iannello A., Vitale N., Vaisitti T., Deaglio S. Immune Response Dysfunction in Chronic Lymphocytic Leukemia: Dissecting Molecular Mechanisms and Microenvironmental Conditions. Int. J. Mol. Sci. 2020;21:1825. doi: 10.3390/ijms21051825. - DOI - PMC - PubMed
    1. Roessner P.M., Seiffert M. T-cells in chronic lymphocytic leukemia: Guardians or drivers of disease? Leukemia. 2020;34:2012–2024. doi: 10.1038/s41375-020-0873-2. - DOI - PMC - PubMed
    1. D’Arena G., Simeon V., D’Auria F., Statuto T., Sanzo P.D., Martino L.D., Marandino A., Sangiorgio M., Musto P., Feo V.D. Regulatory T-cells in chronic lymphocytic leukemia: Actor or innocent bystander? Am. J. Blood Res. 2013;3:52–57. - PMC - PubMed

Publication types

MeSH terms

LinkOut - more resources