. 2024 Aug 23;25(17):9136.
doi: 10.3390/ijms25179136.

TNFα-Induced Inflammation Model-Evaluation of Concentration and Passage-Dependent Effects on Bovine Chondrocytes

Affiliations

TNFα-Induced Inflammation Model-Evaluation of Concentration and Passage-Dependent Effects on Bovine Chondrocytes

Robert Ossendorff et al. Int J Mol Sci. .

Abstract

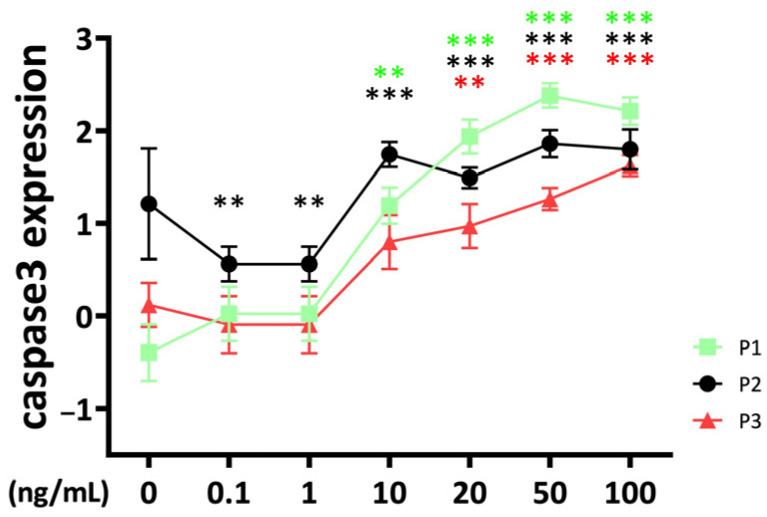
Inflammation models are widely used in the in vitro investigation of new therapeutic approaches for osteoarthritis. TNFα (tumor necrosis factor alpha) plays an important role in the inflammatory process. Current inflammation models lack uniformity and make comparisons difficult. Therefore, this study aimed to systematically investigate whether the effects of TNFα are concentration-dependent and whether chondrocyte expansion has an effect on the inflammatory model. Bovine chondrocytes were enzymatically isolated, expanded to passages 1-3, and transferred into a 3D pellet culture. Chondrocyte pellets were stimulated with recombinant bovine TNFα at different concentrations for 48 h to induce inflammation. Gene expression of anabolic (collagen 2, aggrecan, cartilage oligomeric protein (COMP)), catabolic (matrix metalloproteinases (MMP3, MMP13)), dedifferentiation (collagen 1) markers, inflammation markers (interleukin-6 (IL-6), nuclear factor kappa B (NFkB), cyclooxygenase-2 (COX), prostaglandin-E-synthase-2 (PTGES2)), and the apoptosis marker caspase 3 was determined. At the protein level, concentrations of IL-6, nitric oxide (NO), and sulfated glycosaminoglycans (GAG) were evaluated. Statistical analysis was performed using the independent t-test, and significance was defined as p < 0.05. In general, TNFα caused a decrease in anabolic markers and an increase in the expression of catabolic and inflammatory markers. There was a concentration-dependent threshold of 10 ng/mL to induce significant inflammatory effects. Most of the markers analyzed showed TNFα concentration-dependent effects (COMP, PRG4, AGN, Col1, MMP3, and NFkB). There was a statistical influence of selected gene expression markers from different passages on the TNFα chondrocyte inflammation model, including Col2, MMP13, IL-6, NFkB, COX2, and PTGES2. Considering the expression of collagen 2 and MMP3, passage 3 chondrocytes showed a higher sensitivity to TNFα stimulation compared to passages 1 and 2. On the other hand, MMP13, IL-6, NFkB, and caspase 3 gene expression were lower in P3 chondrocytes compared to the other passages. On the protein level, inflammatory effects showed a similar pattern, with cytokine effects starting at 10 ng/mL and differences between the passages. TNFα had a detrimental effect on cartilage, with a clear threshold observed at 10 ng/mL. Although TNFα effects showed concentration-dependent patterns, this was not consistent for all markers. The selected passage showed a clear influence, especially on inflammation markers. Further experiments were warranted to explore the effects of TNFα concentration and passage in long-term stimulation.

Keywords: TNFα; bovine; cartilage; chondrocyte; cytokine; inflammation model.


Conflict of interest statement

The authors declare no conflicts of interest. The funders had no role in the design of the study; in the collection, analyses, or interpretation of data; in the writing of the manuscript; or in the decision to publish the results.

Figures

Figure 1
Figure 1
Gene expression of anabolic markers (a) collagen 2 (Col2), (b) cartilage oligomeric protein (COMP), (c) aggrecan and (d) collagen 1 (Col1) from different passages treated with different doses (0.1 ng/mL, 1 ng/mL, 10 ng/mL, 20 ng/mL, 50 ng/mL, and 100 ng/mL) of TNFα for 48 h in a bovine chondrocyte pellet culture model. Gene expression data were normalized to day 0 and natural log transformed. * p < 0.05; ** p < 0.01; *** p < 0.001. The green, black, and red stars represent comparisons with the control group in passage 1, passage 2, and passage 3, respectively. Figures show only results compared within the same passage. P1: passage 1; P2: passage 2; P3: passage 3; Col2: collagen 2; Col1: collagen 1; COMP: cartilage oligomeric protein.
Figure 2
Figure 2
Gene expression of catabolic markers matrix metalloproteinases (a) MMP3 and (b) MMP13 from different passages treated with different doses (0.1 ng/mL, 1 ng/mL, 10 ng/mL, 20 ng/mL, 50 ng/mL, and 100 ng/mL) of recombinant bovine TNFα for 48 h. Gene expression data were normalized to day 0. Results were natural log transformed. * p < 0.05; ** p < 0.01; *** p < 0.001. The green, black, and red asterisks represent comparisons with the control at passage 1, passage 2, and passage 3, respectively. Figures show only results compared within the same passage. P1: passage 1; P2: passage 2; P3: passage 3; MMP3: matrix metalloproteinase 3; MMP13: matrix metalloproteinase 13.
Figure 3
Figure 3
Gene expression of inflammation markers (a) interleukin-6 (IL-6), (b) nuclear factor kappa b 1 (NFkb1), (c) cyclooxygenase-2 (COX2) and (d) prostaglandin E synthase 2 (PTGES2) of bovine chondrocytes from different passages treated with different doses (0.1 ng/mL, 1 ng/mL, 10 ng/mL, 20 ng/mL, 50 ng/mL, and 100 ng/mL) of recombinant bovine TNFα for 48 h. Gene expression data were normalized to day 0. Results were natural log transformed. * p < 0.05; ** p < 0.01; *** p < 0.001. The green, black, and red stars represent comparisons with the control group in passage 1, passage 2, and passage 3, respectively. Figures show only results compared within the same passage. P1: passage 1; P2: passage 2; P3: passage 3; IL-6: interleukin-6; NFkb1: nuclear factor kappa 1; COX2: cyclooxygenase-2; PTGES2: prostaglandin E synthase 2.
Figure 4
Figure 4
Apoptosis marker caspase 3, gene expression from bovine chondrocytes of different passages treated with different doses (0.1 ng/mL, 1 ng/mL, 10 ng/mL, 20 ng/mL, 50 ng/mL, and 100 ng/mL) of recombinant bovine TNFα for 48 h. Gene expression data were normalized to day 0. Results were natural log transformed. ** p < 0.01; *** p < 0.001. The green, black, and red stars represent comparisons with the control group in passage 1, passage 2, and passage 3, respectively. Figures show only results compared within the same passage. P1: passage 1; P2: passage 2; P3: passage 3.
Figure 5
Figure 5
Functional analysis of the cell-related medium release of (a) glycosaminoglycans (GAGs; µg/mL), (b) nitric oxide (NO; µM), and (c) interleukin-6 (IL-6; pg/mL) from bovine chondrocytes from different passages treated with different doses (0.1 ng/mL, 1 ng/mL, 10 ng/mL, 20 ng/mL, 50 ng/mL, and 100 ng/mL) of recombinant bovine TNFα for 48 h. * p < 0.05; ** p < 0.01; *** p < 0.001. The green, black, and red stars represent comparisons with the control group in passage 1, passage 2, and passage 3, respectively. P1: passage 1; P2: passage 2; P3: passage 3.
Figure 6
Figure 6
Schematic of the experimental design. Chondrocytes were expanded in vitro and then transferred into a 3D pellet culture for chondrogenic differentiation for one week. After stimulation with different concentrations of bovine recombinant TNFα for 48 h, chondrocyte pellets were collected for RT-PCR analysis. P0: passage 0; P1: passage 1; P2: passage 2; P3: passage 3. Day 0 referred to the first day that chondrocytes were exposed to TNFα stimulation in the experimental setting.

References

    1. Allen K.D., Thoma L.M., Golightly Y.M. Epidemiology of osteoarthritis. Osteoarthr. Cartil. 2022;30:184–195. doi: 10.1016/j.joca.2021.04.020. - DOI - PMC - PubMed
    1. Ossendorff R., Thimm D., Wirtz D.C., Schildberg F.A. Methods of Conservative Intra-Articular Treatment for Osteoarthritis of the Hip and Knee. Dtsch. Arztebl. Int. 2023;120:575–581. doi: 10.3238/arztebl.m2023.0154. - DOI - PMC - PubMed
    1. Jin Z., Wang D., Zhang H., Liang J., Feng X., Zhao J., Sun L. Incidence trend of five common musculoskeletal disorders from 1990 to 2017 at the global, regional and national level: Results from the global burden of disease study 2017. Ann. Rheum. Dis. 2020;79:1014–1022. doi: 10.1136/annrheumdis-2020-217050. - DOI - PubMed
    1. Hunter D.J., Schofield D., Callander E. The individual and socioeconomic impact of osteoarthritis. Nat. Rev. Rheumatol. 2014;10:437–441. doi: 10.1038/nrrheum.2014.44. - DOI - PubMed
    1. Zheng L., Zhang Z., Sheng P., Mobasheri A. The role of metabolism in chondrocyte dysfunction and the progression of osteoarthritis. Ageing Res. Rev. 2021;66:101249. doi: 10.1016/j.arr.2020.101249. - DOI - PubMed

LinkOut - more resources