

Effects of Dietary Bio-Fermented Selenium Supplementation on Growth, Immune Performance, and Intestinal Microflora of Chinese Mitten Crabs, Eriocheir sinensis
- PMID: 39273167
- PMCID: PMC11394762
- DOI: 10.3390/ijms25179219
Effects of Dietary Bio-Fermented Selenium Supplementation on Growth, Immune Performance, and Intestinal Microflora of Chinese Mitten Crabs, Eriocheir sinensis
Abstract
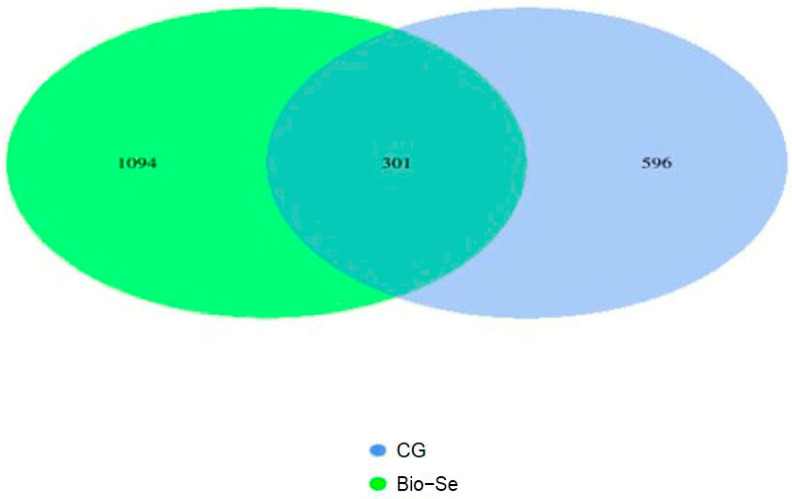
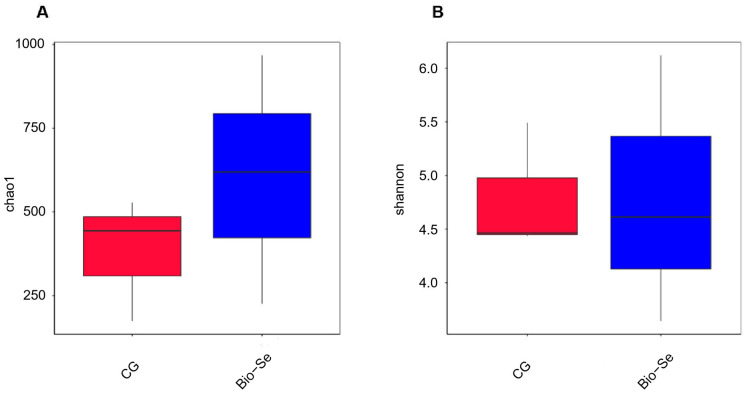
Selenium is a vital trace mineral that is crucial for maintaining regular biological processes in aquatic animals. In this study, a four-week dietary trial was carried out to assess the impact of bio-fermented selenium (Bio-Se) on the growth and immune response of Chinese mitten crabs, Eriocheir sinensis. The crabs were randomly allocated to five dietary treatment groups, each receiving a different dose of Bio-Se. The doses included 0, 0.3, 0.6, 1.5, and 3.0 mg/kg and were accurately measured in basal diet formulations. The results showed the weight gain rate (WGR), specific growth rate (SGR), and survival rate (SR) in the 1.5 mg/kg Bio-Se group were the highest, and 3.0 mg/kg of Bio-Se has an inhibitory effect on the WGR, SGR, and SR. The activities of the immune enzymes, including glutathione peroxidase (GPX), superoxide dismutase (SOD), and acid phosphatase (ACP), of the hepatopancreas were significantly (p < 0.05) increased in the 1.5 mg/kg Bio-Se group, while they decreased (p < 0.05) in the 3.0 mg/kg feeding group compared to the 0 mg/kg feeding group. The concentration of maleic dialdehyde (MDA) exhibited the opposite pattern. Similarly, the mRNA expression levels of antimicrobial peptides (ALF-1, Crus-1, and LYS), ERK, and Relish genes were also observed to be the highest in the 1.5 mg/kg Bio-Se group compared with the other groups. Furthermore, the administration of 1.5 mg/kg of Bio-Se resulted in an increase in the thickness of the intestinal plica and mucosal layer, as well as in alterations in the intestinal microbial profile and bacterial diversity compared to the dose of 0 mg/kg of Bio-Se. Notably, the population of the beneficial bacterial phylum Fusobacteria was increased after crabs were fed the 1.5 mg/kg Bio-Se diet. In conclusion, the oral administration of 1.5 mg/kg of Bio-Se improved the growth efficiency, antioxidant capabilities, immunity, and intestinal health of E. sinensis. Through a broken-line analysis of the WGR against dietary Bio-Se levels, optimal dietary Bio-Se levels were determined to be 1.1 mg/kg. These findings contribute valuable insights to the understanding of crab cultivation and nutrition.
Keywords: Bio−Se; Eriocheir sinensis; growth performance; immune response; intestinal microflora.
Conflict of interest statement
The authors declare no conflicts of interest.
Figures


References
-
- Chanda S., Paul B.N., Ghosh K., Giri S.S. Dietary Essentiality of Trace Minerals in Aquaculture-A Review. Agric. Rev. 2015;36:100–112. doi: 10.5958/0976-0741.2015.00012.4. - DOI
-
- Steven J.H. Review of Selenium Toxicity in The Aquatic Food Chain. Sci. Total Environ. 2004;326:1–31. - PubMed
-
- Leonardo S.T., Jaqueline Dalbello B.T., Cleber Fernando M.M., Elisabeth C.U., Rodrigo Y.G., Marcos V.S. Long-term Organic Selenium Supplementation Overcomes the Trade-off Between Immune and Antioxidant Systems in Pacu (Piaractus mesopotamicus) Fish Shellfish Immunol. 2017;60:311–317. - PubMed
-
- Silva-Brito F., Magnoni L.J., Fonseca S.B., Peixoto M.J., Castro L.F., Cunha I., Magalhães F.A., Gonçalves J.F. Dietary Oil Source and Selenium Supplementation Modulate Fads2 and Elovl5 Transcriptional Levels in Liver and Brain of Meagre (Argyrosomus regius) Lipids. 2016;51:729–741. doi: 10.1007/s11745-016-4157-6. - DOI - PubMed
-
- Schwarz K., Folts C.M. Selenium as An Integral Part of Factor Against Dietary Necrotic Liver Degeneration. Nutrition. 1999;15:255. - PubMed
MeSH terms
Substances
Grants and funding
LinkOut - more resources
Full Text Sources
Medical
Research Materials
Miscellaneous
