Transcriptome-Based Screening of Candidate Low-Temperature-Associated Genes and Analysis of the BocARR-B Transcription Factor Gene Family in Kohlrabi (Brassica oleracea L. var. caulorapa L.)
- PMID: 39273211
- PMCID: PMC11394831
- DOI: 10.3390/ijms25179261
Transcriptome-Based Screening of Candidate Low-Temperature-Associated Genes and Analysis of the BocARR-B Transcription Factor Gene Family in Kohlrabi (Brassica oleracea L. var. caulorapa L.)
Abstract
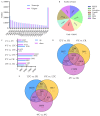
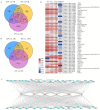
Low temperature is a significant abiotic stress factor that not only impacts plant growth, development, yield, and quality but also constrains the geographical distribution of numerous wild plants. Kohlrabi (Brassica oleracea L. var. caulorapa L.) belongs to the Brassicaceae family and has a short growing period. In this study, a total of 196,642 unigenes were obtained from kohlrabi seedlings at low temperatures; of these, 52,836 unigenes were identified as differentially expressed genes. Transcription factor family members ARR-B, C3H, B3-ARF, etc. that had a high correlation with biochemical indicators related to low temperature were identified. A total of nineteen BocARR-B genes (named BocARR-B1-BocARR-B19) were obtained, and these genes were distributed unevenly across seven chromosomes. Nineteen BocARR-B genes searched four conserved motifs and were divided into three groups. The relative expression level analysis of 19 BocARR-B genes of kohlrabi showed obvious specificity in different tissues. This study lays a foundation and provides new insight to explain the low-temperature resistance mechanism and response pathways of kohlrabi. It also provides a theoretical basis for the functional analysis of 19 BocARR-B transcription factor gene family members.
Keywords: BocARR-B transcription factor; differentially expressed genes; gene relative expression level analysis; kohlrabi (Brassica oleracea L. var. caulorapa L.); low-temperature stress; metabolites networks.
Conflict of interest statement
The authors declare no conflicts of interest.
Figures


Similar articles
-
Differentially Expressed Genes Identification of Kohlrabi Seedlings (Brassica oleracea var. caulorapa L.) under Polyethylene Glycol Osmotic Stress and AP2/ERF Transcription Factor Family Analysis.Plants (Basel). 2024 Apr 22;13(8):1167. doi: 10.3390/plants13081167. Plants (Basel). 2024. PMID: 38674577 Free PMC article.
-
Anthocyanin Accumulation and Molecular Analysis of Correlated Genes in Purple Kohlrabi (Brassica oleracea var. gongylodes L.).J Agric Food Chem. 2015 Apr 29;63(16):4160-9. doi: 10.1021/acs.jafc.5b00473. Epub 2015 Apr 15. J Agric Food Chem. 2015. PMID: 25853486
-
Genome-Wide Analysis of Basic Helix-Loop-Helix Superfamily Members Reveals Organization and Chilling-Responsive Patterns in Cabbage (Brassica oleracea var. capitata L.).Genes (Basel). 2019 Nov 8;10(11):914. doi: 10.3390/genes10110914. Genes (Basel). 2019. PMID: 31717469 Free PMC article.
-
Comparative transcriptome analysis during tuberous stem formation in Kohlrabi (B. oleracea var. gongylodes) at early growth periods (seedling stages).Physiol Plant. 2022 Sep;174(5):e13770. doi: 10.1111/ppl.13770. Physiol Plant. 2022. PMID: 36018597
-
Analysis of SI-Related BoGAPDH Family Genes and Response of BoGAPC to SI Signal in Brassica oleracea L.Genes (Basel). 2021 Oct 28;12(11):1719. doi: 10.3390/genes12111719. Genes (Basel). 2021. PMID: 34828325 Free PMC article.
References
-
- Soltan H.A.H., Osman S.A.M., Tantawy I.A.A. The Role of New Transformants Phosphate Bio-Stimulates (PBS) Bacteria Inoculates on Growth. Yield and Quality of Kohlrabi Plants. J. Plant Sci. 2021;12:541–551. doi: 10.21608/jpp.2021.178930. - DOI
-
- Lim T. Edible Medicinal and Non Medicinal Plants. Springer; Dordrecht, The Netherlands: 2015. Brassica oleracea (gongylodes group) pp. 768–776. - DOI
-
- Iradukunda M., Read P.E. Ph.D. Thesis. University of Nebraska; Lincoln, NE, USA: 2022. Influence of Fertilizer Rate on Swollen Stem Formation (“Bulbing”) and Vitamin C Content in Different Kohlrabi Cultivars.
-
- Jahangir M., Kim H.K., Choi Y.H., Verpoorte R. Health-affecting compounds in Brassicaceae. Compr. Rev. Food Sci. Food Saf. 2009;8:31–43. doi: 10.1111/j.1541-4337.2008.00065.x. - DOI
-
- Park W.T., Kim J.K., Park S., Lee S.-W., Li X., Kim Y.B., Uddin M.R., Park N.I., Kim S.-J., Park S.U. Metabolic profiling of glucosinolates, anthocyanins, carotenoids, and other secondary metabolites in kohlrabi (Brassica oleracea var. gongylodes) J. Agric. Food Chem. 2012;60:8111–8116. doi: 10.1021/jf301667j. - DOI - PubMed
MeSH terms
Substances
Grants and funding
LinkOut - more resources
Full Text Sources

