. 2024 Aug 30;25(17):9452.
doi: 10.3390/ijms25179452.

Using Transcriptomics to Determine the Mechanism for the Resistance to Fusarium Head Blight of a Wheat- Th. elongatum Translocation Line

Affiliations

Using Transcriptomics to Determine the Mechanism for the Resistance to Fusarium Head Blight of a Wheat- Th. elongatum Translocation Line

Yi Dai et al. Int J Mol Sci. .

Abstract

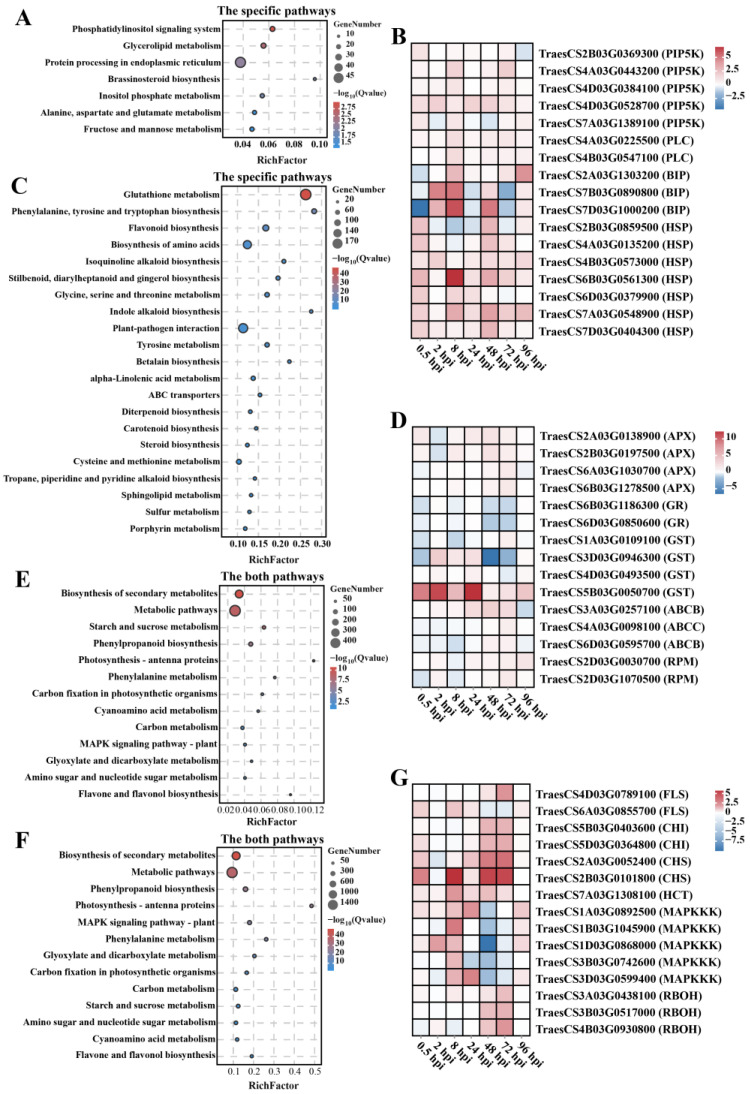
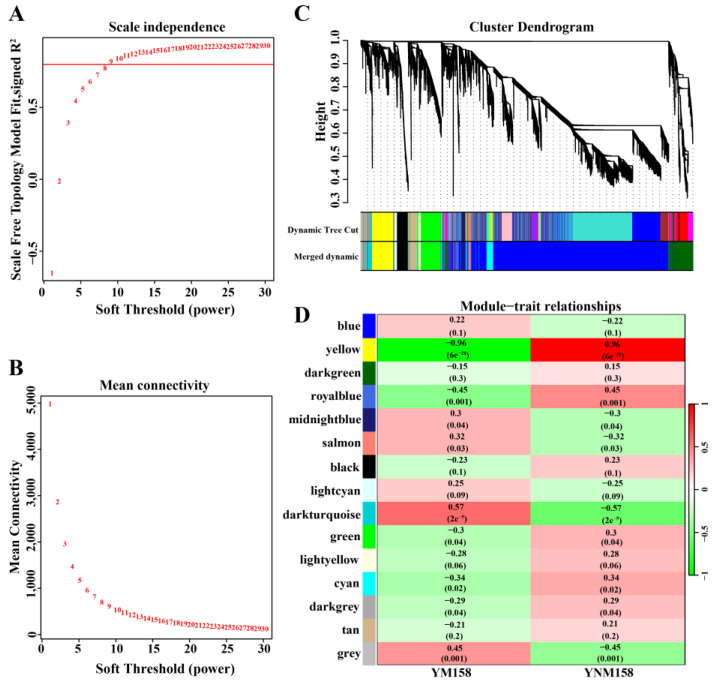
Fusarium head blight (FHB), caused by the Fusarium graminearum species complex, is a destructive disease in wheat worldwide. The lack of FHB-resistant germplasm is a barrier in wheat breeding for resistance to FHB. Thinopyrum elongatum is an important relative that has been successfully used for the genetic improvement of wheat. In this study, a translocation line, YNM158, with the YM158 genetic background carrying a fragment of diploid Th. elongatum 7EL chromosome created using 60Co-γ radiation, showed high resistance to FHB under both field and greenhouse conditions. Transcriptome analysis confirmed that the horizontal transfer gene, encoding glutathione S-transferase (GST), is an important contributor to FHB resistance in the pathogen infection stage, whereas the 7EL chromosome fragment carries other genes regulated by F. graminearum during the colonization stage. Introgression of the 7EL fragment affected the expression of wheat genes that were enriched in resistance pathways, including the phosphatidylinositol signaling system, protein processing in the endoplasmic reticulum, plant-pathogen interaction, and the mitogen-activated protein kinase (MAPK) signaling pathway at different stages after F. graminearium infection. This study provides a novel germplasm for wheat resistance to FHB and new insights into the molecular mechanisms of wheat resistance to FHB.

Keywords: Fusarium head blight; disease resistance pathway; transcriptome analysis; wheat-Th. elongatum translocation line.


Conflict of interest statement

The authors declare no conflicts of interest.

Figures

Figure 1
Figure 1
The establishment of wheat-Th. elongatum 7EL chromosome translocation line YNM158. (A) Mature plants of YNM158 (left) and YM158 (right). Scale bar = 10 cm. (B) GISH analysis of the translocation lines YNM158: diploid Th. elongatum genomic DNA was used as a probe (green); arrows show the translocated chromosome pair. Scale bar = 100 μm. (C) ND-FISH analysis of the translocation lines YNM158: Oligo-pAs1 (red signal) modified with 5′TAMRA and Oligo-pSc119.2 (green signal) modified with 5′FAM were used as probes; chromosomes were counterstained with DAPI (blue), and arrows show the translocated chromosome pairs. Scale bar = 100 μm. (D) Symptoms of YNM158 and the control varieties at 21 dpi with F. graminearum isolate F0609. Scale bar = 2 cm. (E) Statistical analysis of eight agronomic traits for YNM158 and YM158. Statistical significance of differences was evaluated by t-test (* p < 0.05).
Figure 2
Figure 2
Analysis of the differentially expressed genes (DEGs) identified from YNM158. (A) Statistical analysis of the DEGs number on 7EL chromosome at different times after F. graminearum infection. (B) Gene ontology function enrichment analysis of DEGs on 7EL chromosome after F. graminearum infection. (C) KEGG pathway enrichment analysis of DEGs on 7EL chromosome after F. graminearum infection. (D) The heatmap of the DEGs enriched in starch and sucrose metabolism pathway.
Figure 3
Figure 3
Gene expression patterns analysis on 7EL chromosome. (A) The trend analysis of DEGs at different times after F. graminearum infection. (B) Gene dendrogram by clustering the dissimilarity based on topological overlap. (C) Correlation heatmap between modules and infection time with F. graminearum. The 4 modules are provided in the left panel. The module–trait correlation, from −1 (light blue) to 1 (pink), is indicated with the color scale on the right. Each column presents the infection time, and their association with each module is represented by a correlation coefficient (showing top-left corner) and a p-value (showing lower-right corner). (D) Venn diagrams showing the overlapping of DEGs between WGCNA and trend analysis. (EG) Relative expression of Tel7E01G1020600, Tel7E01G946300, and Tel7E01G980900 by qPCR. (H) The correlation analysis between the relative expressions obtained by qPCR and RNA-seq by Pearson correlation analysis. *: p < 0.05; **: p < 0.01 by Student’s t-test.
Figure 4
Figure 4
Screened the DEGs between YM158 and YNM158. (A) DEGs Venn diagram of initial colonization stage. (B) DEGs Venn diagram at infection stage. (C) Different types of specific DEGs statistics.
Figure 5
Figure 5
KEGG pathway enrichment analysis of wheat DEGs. (A) The specific enrichment pathways at the initial colonization stage. (B) The heatmap of the representative DEGs enriched at the initial colonization stage. (C) The specific enrichment pathways at the infection stage. (D) The heatmap of the representative DEGs enriched at the infection stage. (E) The same enrichment pathways at the initial colonization stage. (F) The same enrichment pathways at the infection stage. (G) The heatmap of the representative DEGs enriched at both stages.
Figure 6
Figure 6
WGCNA of wheat DEGs identified in the YM158 and YNM158 after F. graminearum infection. (A) The x-axis represents the soft threshold β. (B) The y-axis represents the mean of all genes’ adjacency functions in the corresponding gene module. (C) Fourteen modules of co-expressed genes are shown in a hierarchical cluster tree. A major tree branch represents a module. Modules in designated colors are presented in the lower panel. (D) Module–trait relationships: The 14 modules are provided in the left panel. The module–trait correlation, from −1 (green) to 1 (red), is indicated with the color scale on the right. The association with each module is represented by a correlation coefficient and a p-value (showing in parentheses).
Figure 7
Figure 7
The core genes extraction and expression verification by RT-PCR. (A) Venn diagram between the hub genes associated with YNM158 and DEGs in the specific pathways at initial colonization stage. (B) Venn diagram between the hub genes associated with YNM158 and DEGs in the specific pathways at infection stage. (C) DEGs Venn diagram between the initial colonization stage and infection stage in the same pathways. (D) Venn diagram between the hub genes associated with YNM158 and DEGs in both stages. (EJ) The relative expression of the core genes in YM158 and YNM158. *: p < 0.05; **: p < 0.01 by Student’s t-test.

Similar articles

Cited by

References

    1. Cuthbert P.A., Somers D.J., Thomas J., Cloutier S., Brule-Babel A. Fine mapping Fhb1, a major gene controlling Fusarium head blight resistance in bread wheat (Triticum aestivum L.) Theor. Appl. Genet. 2006;112:1465–1472. doi: 10.1007/s00122-006-0249-7. - DOI - PubMed
    1. Cuthbert P.A., Somers D.J., Brule-Babel A. Mapping of Fhb2 on chromosome 6BS: A gene controlling Fusarium head blight field resistance in bread wheat (Triticum aestivum L.) Theor. Appl. Genet. 2007;114:429–437. doi: 10.1007/s00122-006-0439-3. - DOI - PubMed
    1. Xue S., Li G.Q., Jia H.Y., Xu F., Lin F., Tang M.Z., Wang Y., An X., Xu H.B., Zhang L.X., et al. Fine mapping Fhb4, a major QTL conditioning resistance to Fusarium infection in bread wheat (Triticum aestivum L.) Theor. Appl. Genet. 2010;121:147–156. doi: 10.1007/s00122-010-1298-5. - DOI - PubMed
    1. Xue S.L., Xu F., Tang M.Z., Zhou Y., Li G.Q., An X., Lin F., Xu H.B., Jia H.Y., Zhang L.X., et al. Precise mapping Fhb5, a major QTL conditioning resistance to Fusarium infection in bread wheat (Triticum aestivum L.) Theor. Appl. Genet. 2011;123:1055–1063. doi: 10.1007/s00122-011-1647-z. - DOI - PubMed
    1. Wang X., Li G.Q., Jia H.Y., Cheng R., Zhong J.K., Shi J.X., Chen R.T., Wen Y.X., Ma Z.Q. Breeding evaluation and precise mapping of Fhb8 for Fusarium head blight resistance in wheat (Triticum aestivum) Plant Breed. 2023;143:26–33. doi: 10.1111/pbr.13113. - DOI

MeSH terms

Supplementary concepts

LinkOut - more resources