. 2024 Aug 31;25(17):9475.
doi: 10.3390/ijms25179475.

Spatiotemporal Dysregulation of Neuron-Glia Related Genes and Pro-/Anti-Inflammatory miRNAs in the 5xFAD Mouse Model of Alzheimer's Disease

Affiliations

Spatiotemporal Dysregulation of Neuron-Glia Related Genes and Pro-/Anti-Inflammatory miRNAs in the 5xFAD Mouse Model of Alzheimer's Disease

Marta Ianni et al. Int J Mol Sci. .

Abstract

Alzheimer's disease (AD), the leading cause of dementia, is a multifactorial disease influenced by aging, genetics, and environmental factors. miRNAs are crucial regulators of gene expression and play significant roles in AD onset and progression. This exploratory study analyzed the expression levels of 28 genes and 5 miRNAs (miR-124-3p, miR-125b-5p, miR-21-5p, miR-146a-5p, and miR-155-5p) related to AD pathology and neuroimmune responses using RT-qPCR. Analyses were conducted in the prefrontal cortex (PFC) and the hippocampus (HPC) of the 5xFAD mouse AD model at 6 and 9 months old. Data highlighted upregulated genes encoding for glial fibrillary acidic protein (Gfap), triggering receptor expressed on myeloid cells (Trem2) and cystatin F (Cst7), in the 5xFAD mice at both regions and ages highlighting their roles as critical disease players and potential biomarkers. Overexpression of genes encoding for CCAAT enhancer-binding protein alpha (Cebpa) and myelin proteolipid protein (Plp) in the PFC, as well as for BCL2 apoptosis regulator (Bcl2) and purinergic receptor P2Y12 (P2yr12) in the HPC, together with upregulated microRNA(miR)-146a-5p in the PFC, prevailed in 9-month-old animals. miR-155 positively correlated with miR-146a and miR-21 in the PFC, and miR-125b positively correlated with miR-155, miR-21, while miR-146a in the HPC. Correlations between genes and miRNAs were dynamic, varying by genotype, region, and age, suggesting an intricate, disease-modulated interaction between miRNAs and target pathways. These findings contribute to our understanding of miRNAs as therapeutic targets for AD, given their multifaceted effects on neurons and glial cells.

Keywords: 5xFAD mouse model; Alzheimer’s disease; hippocampus; microRNAs; neurodegeneration; neuroimmune genes; neuroinflammation; prefrontal cortex.


Conflict of interest statement

The authors declare no conflicts of interest. The founders had no role in the design of the study; in the collection, analyses, or interpretation of data; in the writing of the manuscript; or in the decision to publish the results.

Figures
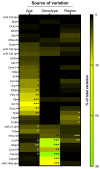
Figure 1
Figure 1
Heatmap displaying the major individual sources of variation in each of our pre-selected miRNAs and genes, by RT-qPCR analysis. Results were obtained by a three-way ANOVA (α = 0.05), with Šídák’s multiple comparisons test for the factors: age (6 vs. 9 months), genotype (WT vs. 5xFAD), and region (hippocampus vs. prefrontal cortex). * p < 0.05, ** p < 0.01 and *** p < 0.001.
Figure 2
Figure 2
Significant differences in gene expression profiles in the prefrontal cortex (PFC) and hippocampus (HPC) of 5xFAD mice, at 6 and 9 months of age assessed by RT-qPCR analysis. Upregulation of Gfap (A), Trem2 (B), and Cst7 (C) was revealed to be the most consistent markers, as they are also not dependent on age or brain region. Cebpa (D) and Plp (E) were shown to increase with aging in the PFC of 5xFAD mice. Traf6 (F) showed regional-dependent differences only in control mice, whereas the Bcl2 (G) and P2yr12 (H) genes exhibited elevated levels in the HPC compared to the PFC. Three-way ANOVA (α = 0.05) with Šídák’s multiple comparisons test for the following factors: age (6 vs. 9 months), genotype (WT vs. 5xFAD), and region (HPC vs. PFC). Statistical significance: Age comparisons: * p < 0.05, ** p < 0.01 and *** p < 0.001; genotype comparisons # p < 0.05, ## p < 0.01 and ### p < 0.001; region comparisons: § p < 0.05, §§ p < 0.01 and §§§ p < 0.001.
Figure 3
Figure 3
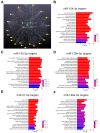
Inflamma-miRNA network and gene ontology. (A) miRNA–target network-map for the analyzed microRNAs and targets selected for this study. (B) miR-124-3p gene ontology enriched analysis. (C) miR-155-5p gene ontology enriched analysis. (D) miR-125b-5p gene ontology enriched analysis. (E) miR-21-5p gene ontology enriched analysis. (F) miR-146a-3p gene ontology enriched analysis.
Figure 4
Figure 4
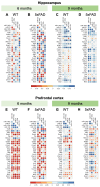
Inflamma-miRNA expression levels, heat map diagram, and cluster analysis of miRNAs and genes considering age and genotype. (A) Expression level of each hit inflamma-miRNA by RT-qPCR. Three-way ANOVA (α = 0.05), with Šídák’s multiple comparisons test for the following factors: age (6 vs. 9 months), genotype (WT vs. 5xFAD), and region (hippocampus vs. prefrontal cortex). Age comparisons: ## p < 0.01. (B) Clustered heatmap of the differentially expressed genes and miRNAs. The parameters whose expression is greater in the case group are shown in green and those smaller in red. Darker colors represent less significant values.
Figure 5
Figure 5
Correlation analysis between the investigated set of miRNAs and gene expression levels in the 5xFAD mouse model of AD. The correlation matrix represents the pairwise correlations using Pearson’s correlation coefficient. Positive correlations are shown in blue and negative correlations in red. Color intensity and size of the circles are proportional to the correlation coefficient. (A) WT, 6 months hippocampus; (B) 5xFAD, 6 months hippocampus; (C) WT, 9 months hippocampus; (D) 5xFAD, 9 months hippocampus; (E) WT, 6 months prefrontal cortex; (F) 5xFAD, 6 months prefrontal cortex; (G) WT, 9 months prefrontal cortex; (H) 5xFAD, 9 months prefrontal cortex. Significance of Pearson’s correlation coefficients: * p < 0.05, ** p < 0.01 and, *** p < 0.001.

References

    1. McKeever P.M., Schneider R., Taghdiri F., Weichert A., Multani N., Brown R.A., Boxer A.L., Karydas A., Miller B., Robertson J., et al. MicroRNA Expression Levels Are Altered in the Cerebrospinal Fluid of Patients with Young-Onset Alzheimer’s Disease. Mol. Neurobiol. 2018;55:8826–8841. doi: 10.1007/s12035-018-1032-x. - DOI - PMC - PubMed
    1. Korczyn A.D., Grinberg L.T. Is Alzheimer disease a disease? Nat. Rev. Neurol. 2024;20:245–251. doi: 10.1038/s41582-024-00940-4. - DOI - PMC - PubMed
    1. Pittock R.R., Aakre J.A., Castillo A.M., Ramanan V.K., Kremers W.K., Jack C.R., Jr., Vemuri P., Lowe V.J., Knopman D.S., Petersen R.C., et al. Eligibility for Anti-Amyloid Treatment in a Population-Based Study of Cognitive Aging. Neurology. 2023;101:e1837–e1849. doi: 10.1212/WNL.0000000000207770. - DOI - PMC - PubMed
    1. Knopman D.S., Amieva H., Petersen R.C., Chetelat G., Holtzman D.M., Hyman B.T., Nixon R.A., Jones D.T. Alzheimer disease. Nat. Rev. Dis. Primers. 2021;7:33. doi: 10.1038/s41572-021-00269-y. - DOI - PMC - PubMed
    1. Xia X., Jiang Q., McDermott J., Han J.J. Aging and Alzheimer’s disease: Comparison and associations from molecular to system level. Aging Cell. 2018;17:e12802. doi: 10.1111/acel.12802. - DOI - PMC - PubMed

MeSH terms

LinkOut - more resources