. 2024 Sep 3;25(17):9567.
doi: 10.3390/ijms25179567.

Simultaneous Detection of Collagen I Alpha II and Cytokeratin 19 mRNA by Multiplex qPCR in Liquid Biopsy in Diagnosis of Patients with Resectable Solid Tumors

Affiliations

Simultaneous Detection of Collagen I Alpha II and Cytokeratin 19 mRNA by Multiplex qPCR in Liquid Biopsy in Diagnosis of Patients with Resectable Solid Tumors

Lara Sofía Estévez Pérez et al. Int J Mol Sci. .

Abstract

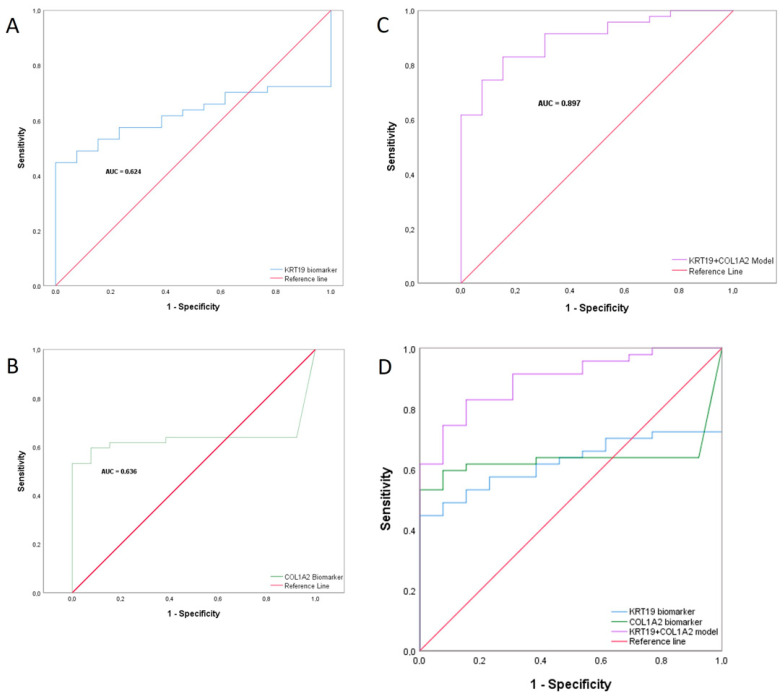
The early detection of tumors is one of the key factors in increasing overall survival in cancer patients. A wide range of cancers still do not have a system of early diagnosis; therefore, the development of new non-invasive tools in this line is essential. Accordingly, the objective of our work was to develop a non-invasive screening method for the early detection of various carcinomas in plasma using a panel that combines two markers using RT-qPCR. A retrospective case-control study was conducted to develop a cancer screening test based on the detection of stromal and epithelial biomarkers (COL1A2 and KRT19) in plasma. The expression of biomarkers was evaluated using multiplex quantitative PCR applied to 47 cases with non-metastatic tumors and 13 control participants. For both biomarkers, a cut-off value was stablished using Youden's J index through ROC curve analysis and areas under the curve (AUC) were calculated. The plasma mRNA expression level of both biomarkers was significantly higher in diseased versus healthy patients. Moreover, ROC curve analysis showed an AUC value of 0.897 for the combined model. This model also resulted in a cutoff value of 0.664, as well as a sensitivity of 83% and a specificity of 84.6%. These results suggest that the plasma expression levels of COL1A2 and KRT19 could a have potential role in detecting various types of cancer at the early stages. The combined analysis of both stromal and epithelial biomarkers would provide a non-invasive screening method that would allow us to differentiate patients with an active neoplastic process.

Keywords: COL1A2; KRT19; early detection multi-cancer screening; liquid biopsy; multiplex RT-qPCR.


Conflict of interest statement

Authors Saioa Domínguez Hormaetxe and Laureano Simón were employed by the company Oncomatryx Biopharma. The remaining authors declare that the research was conducted in the absence of any commercial or financial relationships that could be construed as a potential conflict of interest.

Figures

Figure 1
Figure 1
RT-qPCR amplification plots of using seven different 10-fold dilutions (10−1 to 10−7) of standard RNA in singleplex and multiplex reactions. For COL1A2 (A,B), KRT19 (C,D) and ACTB (E,F) four intermedia points were added. The assay was performed as a singleplex and multiplex reactions to investigate the potential interaction between the primers. Overlapping amplification curves in the singleplex (A,C,E) and triplex reactions (G,H) did not identify any inhibitory effect. Ct values were plotted on the y axis and serial ten-fold dilutions of the RNA template on the x axis (right panel).
Figure 2
Figure 2
Comparative analysis of mRNA expression level in plasma of ACs vs. CPs. (A) Box plot showing the distribution of ΔCt values for tumoral biomarkers (COL1A2 and KRT19) in ACs (n = 13) and CPs (n = 47). The median ΔCt value is represented as a black line within the box plot, and it divides the ΔCt values into lower and upper quartile ranges. The whiskers represent the upper and lower data range in AC and CP samples. Data showed significant differences in ΔCt values between two cohorts of patients (p < 0.0001 for COL1A2 and p = 0.0031 for KRT19). (B) Comparison of ΔCt values of COL1A2 and KRT19. Statistic tests showed significant different expressions between groups in both biomarkers (COL1A2, p-value < 0.0001, KRT19, p-value < 0.0040). (C) Relative fold expression of COL1A2 and KRT19 between AC and CP cohorts of patients. Data showed higher expression levels of COL1A2 and KRT19 in CP individuals. Mann–Whitney U tests showed that these differences were significant between groups in all biomarkers (COL1A2, p < 0.0001 and KRT19, p = 0.0031). Data are expressed as mean ± SD. Asterisks denote significant differences between groups ACs and CPs for each gene (**** p-value < 0.0001; ** p-value < 0.01).
Figure 3
Figure 3
COL1A2/KRT19 mRNA fold change in the different group of tumors studied. Mann–Whitney U-test contrasts the mean in fold of control of two independent groups: AC (n = 13) vs. cancer patients’ groups (A) CRC (n = 31), (B) (RC; n = 6), (C) (BCC; n = 4), (D) (PC; n = 3), and (E) (Others E, n = 3) (gastric, mama and penile cancer). (F) Outlook for both markers and tumors. Graphs represent mean ±  SD, **** p < 0.0001, *** p < 0.001, ** p < 0.01, * p < 0.05.
Figure 4
Figure 4
Graphical representation of the ROC curves for predicting cancer by profiling patients according to their expression level of KRT19, COL1A2 or both. (A) ROC curve for predicting cancer by KRT19 biomarker, AUC = 0.624 95% IC (0.490–0.757) Sensitivity = 0.617, Specificity = 0.615. (B) ROC curve for predicting cancer by COL1A2 biomarker, AUC = 0.636 95% IC (0.501–0.771) Sensitivity = 0.617, Specificity = 0.845. (C) ROC curve for predicting cancer using a combined biomarkers KRT19 + COL1A2, AUC = 0.897 95% IC (0.815–0.979), p-value = 0.000. Cut-off = 0.664. Sensitivity = 83%, Specificity = 84.6%. (D) COL1A2, KRT19 and combined model ROC curves. AUC denotes the area under the curve. The straight line in orange represents the line of discrimination (ND line), which divides the square of area 1.00 into two equal halves.
Figure 5
Figure 5
Graphical representation of the PR curve showing precision (0.830) and recall (0.951) values for the cut-off point (0.664).

References

    1. Bray F., Laversanne M., Sung H., Ferlay J., Siegel R.L., Soerjomataram I., Jemal A. Global cancer statistics 2022: GLOBOCAN estimates of incidence and mortality worldwide for 36 cancers in 185 countries. CA A Cancer J. Clin. 2024;74:229–263. doi: 10.3322/caac.21834. - DOI - PubMed
    1. Vogelstein B., Papadopoulos N., Velculescu V.E., Zhou S., Diaz L.A., Jr., Kinzler K.W. Cancer Genome Landscapes. Science. 2013;339:1546–1558. doi: 10.1126/science.1235122. - DOI - PMC - PubMed
    1. Jones S., Chen W.-D., Parmigiani G., Diehl F., Beerenwinkel N., Antal T., Traulsen A., Nowak M.A., Siegel C., Velculescu V.E., et al. Comparative lesion sequencing provides insights into tumor evolution. Proc. Natl. Acad. Sci. USA. 2008;105:4283–4288. doi: 10.1073/pnas.0712345105. - DOI - PMC - PubMed
    1. Schröder F.H., Hugosson J., Roobol-Bouts M.J., Tammela T.L.J., Ciatto S., Nelen V., Kwiatkowski M., Lujan M., Lilja H., Zappa M., et al. Screening and prostate-cancer mortality in a randomized European study. N. Engl. J. Med. 2009;360:1320–1328. doi: 10.1056/NEJMoa0810084. - DOI - PubMed
    1. Denters M.J., Deutekom M., Essink-Bot M.L., Bossuyt P.M., Fockens P., Dekker E. FIT false-positives in colorectal cancer screening experience psychological distress up to 6 weeks after colonoscopy. Support. Care Cancer. 2013;21:2809–2815. doi: 10.1007/s00520-013-1867-7. - DOI - PubMed

MeSH terms

LinkOut - more resources