. 2024 Sep 6;25(17):9658.
doi: 10.3390/ijms25179658.

Exploring the Rhizospheric Microbial Communities under Long-Term Precipitation Regime in Norway Spruce Seed Orchard

Affiliations

Exploring the Rhizospheric Microbial Communities under Long-Term Precipitation Regime in Norway Spruce Seed Orchard

Dagmar Zádrapová et al. Int J Mol Sci. .

Abstract

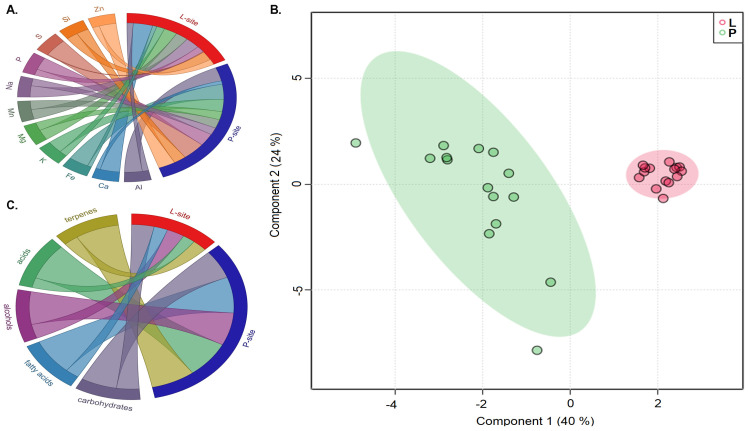
The rhizosphere is the hotspot for microbial enzyme activities and contributes to carbon cycling. Precipitation is an important component of global climate change that can profoundly alter belowground microbial communities. However, the impact of precipitation on conifer rhizospheric microbial populations has not been investigated in detail. In the present study, using high-throughput amplicon sequencing, we investigated the impact of precipitation on the rhizospheric soil microbial communities in two Norway Spruce clonal seed orchards, Lipová Lhota (L-site) and Prenet (P-site). P-site has received nearly double the precipitation than L-site for the last three decades. P-site documented higher soil water content with a significantly higher abundance of Aluminium (Al), Iron (Fe), Phosphorous (P), and Sulphur (S) than L-site. Rhizospheric soil metabolite profiling revealed an increased abundance of acids, carbohydrates, fatty acids, and alcohols in P-site. There was variance in the relative abundance of distinct microbiomes between the sites. A higher abundance of Proteobacteria, Acidobacteriota, Ascomycota, and Mortiellomycota was observed in P-site receiving high precipitation, while Bacteroidota, Actinobacteria, Chloroflexi, Firmicutes, Gemmatimonadota, and Basidiomycota were prevalent in L-site. The higher clustering coefficient of the microbial network in P-site suggested that the microbial community structure is highly interconnected and tends to cluster closely. The current study unveils the impact of precipitation variations on the spruce rhizospheric microbial association and opens new avenues for understanding the impact of global change on conifer rizospheric microbial associations.

Keywords: FUNGuild; Norway spruce; PICRUSt2; amplicon sequencing; microbial communities; network analysis; precipitation; rhizosphere; seed orchards; soil metabolites.


Conflict of interest statement

The authors declare no conflict of interest. The funders had no role in the design of the study; in the collection, analyses, or interpretation of data; in the writing of the manuscript; or in the decision to publish the results.

Figures

Figure 1
Figure 1
(A) Amount of selected elements (in percentage) present in rhizospheric soil samples from Lipová (L-site) and Prenet (P-site) (B) Relative abundance of different classes of metabolites (in percentage) present in the soil samples from the two sites. (C) Sparse partial least square discriminant analysis (sPLS-DA) plot representing the differences in the metabolite profiles in rhizospheric soil samples from two different sites, Lipová site (L) and Prenet site (P), with fifteen replicates (3 replicates from each clonal tree variety).
Figure 2
Figure 2
(A) Venn diagram showing the distribution of unique and common bacterial ASVs shared between two different rhizospheric soil samples (Lipová and Prenet soil). (B) The evolutionary tree representing the top 100 bacterial genera in soil samples (C) Venn diagram showing the distribution of unique and common fungal ASVs shared between the two different soils. (D) The evolutionary tree representing the top fungal genera present in rhizospheric soils from two sites (Lipová and Prenet). Different colors of the branches indicate different phyla. The relative abundance of each genus in each soil is displayed outside the circle with different colors denoting different rhizosphere samples.
Figure 3
Figure 3
Alpha diversity indices. (A) Chao1 index representing bacterial richness. (B) Shannon index estimating the bacterial diversity. (C) Pielou index representing bacterial evenness. (D) Fungal richness (Chao1 index). (E) Diversity of fungal communities estimated by Shannon index. (F) Pielou index indicating the fungal evenness in the rhizosphere samples from two seed orchards, Lipová (L-site) and Prenet (P-site). The level of significance was determined using the Wilcox test (“*” denotes p < 0.05 and “***” indicates p < 0.001).
Figure 4
Figure 4
Non-metric multi-dimensional scaling analysis (NMDS) displaying (A) the difference in the bacterial communities in Lipová and Prenet rhizospheres. (B) The extent of variation in the fungal communities present in the soil samples. The data points in the same color represent soil samples from the same site. Different symbols designate the soil samples from different locations.
Figure 5
Figure 5
t-test analysis to determine the significant variation of (A) bacterial and (B) fungal communities at the genus level in Lipová and Prenet soils. The last panel denotes the abundance of the genera that significantly differs between the two rhizosphere soils. Each bar represents the mean value of the abundance at the genus level in soil that is significantly different. The right panel denotes the confidential interval between the rhizospheres of the two sites. The left-most part of each circle stands for the lower 95% confidential interval limit, while the right-most part is the upper limit. The center of the circle stands for the difference in the mean value. The color of the circle resembles the soil sample, whose mean value is higher. The right-most value is the p-value of the significance test.
Figure 6
Figure 6
LEfSe [linear discriminant analysis (LDA) Effect Size] analysis indicating the differentially represented microbial biomarkers in the two Norway spruce seed orchards (L, P). (A) The cladogram illustrates the presence of bacterial communities that are significantly different between the two soil samples. (B) The cladogram represents the fungal biomarkers in the rhizosphere of two sites. The circles radiating from inside to outside denote the taxonomic level from phylum to genus. Each circle represents a distinct taxon at the corresponding taxonomic level. The size of each circle is proportional to the relative abundance of each taxon. Bacterial and fungal biomarkers with significant differences are colored according to the color of the corresponding soil samples, whereas yellowish-green circles resemble non-significant species. Red and green nodes indicate that these species contribute highly to the group. The letters above the circles describe the different biomarkers.
Figure 7
Figure 7
(A) Barplot representing the relative ASV abundance contributing to the top 10 gene functions in the rhizospheric soil. “Others” represents the relative ASV abundance for the rest of the gene functions. (B) PCA plot shows overlap in the predicted functional contribution of soil bacterial communities in two sites (Lipová and Prenet) based on PICRUSt2 analysis. (C) Barplot representing the relative ASV abundance contributing to the top 10 fungal guilds in the rhizospheric soil. “Others” represents the relative ASV abundance for the rest of the ecological guilds. (D) PCA plot shows an overlap in the predicted ecological guilds of the fungal population in two sites (Lipová and Prenet) based on FUNGuild analysis.
Figure 8
Figure 8
Co-occurrence network analysis illustrating the interaction between the bacterial communities within (A) L-site (B) P-site. The connections between the nodes indicate significant correlations (Spearman’s correlation coefficient cutoff = ±0.6, p < 0.05). The size of each circle is proportional to the relative abundance of each taxon, and different colors of the nodes indicate different phyla.
Figure 9
Figure 9
Co-occurrence network analysis illustrating the interaction between the fungal communities within (A) L-site (B) P-site. The connections between the nodes indicate significant correlations (Spearman’s correlation coefficient cutoff = ±0.6, p < 0.05). The size of each circle is proportional to the relative abundance of each taxon, and different colors of the nodes indicate different phyla.
Figure 10
Figure 10
The schematic representation illustrates the impact of long-term precipitation change on the rhizosphere microbiome from two Norway spruce seed orchards.

Similar articles

References

    1. Baldrian P. Forest microbiome: Diversity, complexity and dynamics. FEMS Microbiol. Rev. 2017;41:109–130. doi: 10.1093/femsre/fuw040. - DOI - PubMed
    1. Lladó S., López-Mondéjar R., Baldrian P. Forest soil bacteria: Diversity, involvement in ecosystem processes, and response to global change. Microbiol. Mol. Biol. Rev. 2017;81:10–1128. doi: 10.1128/MMBR.00063-16. - DOI - PMC - PubMed
    1. Malhi Y., Baldocchi D., Jarvis P. The carbon balance of tropical, temperate and boreal forests. Plant Cell Environ. 1999;22:715–740. doi: 10.1046/j.1365-3040.1999.00453.x. - DOI
    1. Martinović T., Mašínová T., López-Mondéjar R., Jansa J., Štursová M., Starke R., Baldrian P. Microbial utilization of simple and complex carbon compounds in a temperate forest soil. Soil Biol. Biochem. 2022;173:108786. doi: 10.1016/j.soilbio.2022.108786. - DOI
    1. Li X., Yan Y., Lu X., Fu L., Liu Y. Responses of soil bacterial communities to precipitation change in the semi-arid alpine grassland of Northern Tibet. Front. Plant Sci. 2022;13:1036369. doi: 10.3389/fpls.2022.1036369. - DOI - PMC - PubMed

LinkOut - more resources