. 2024 Sep 6;25(17):9675.
doi: 10.3390/ijms25179675.

WormCNN-Assisted Establishment and Analysis of Glycation Stress Models in C. elegans: Insights into Disease and Healthy Aging

Affiliations

WormCNN-Assisted Establishment and Analysis of Glycation Stress Models in C. elegans: Insights into Disease and Healthy Aging

Yan Pan et al. Int J Mol Sci. .

Abstract

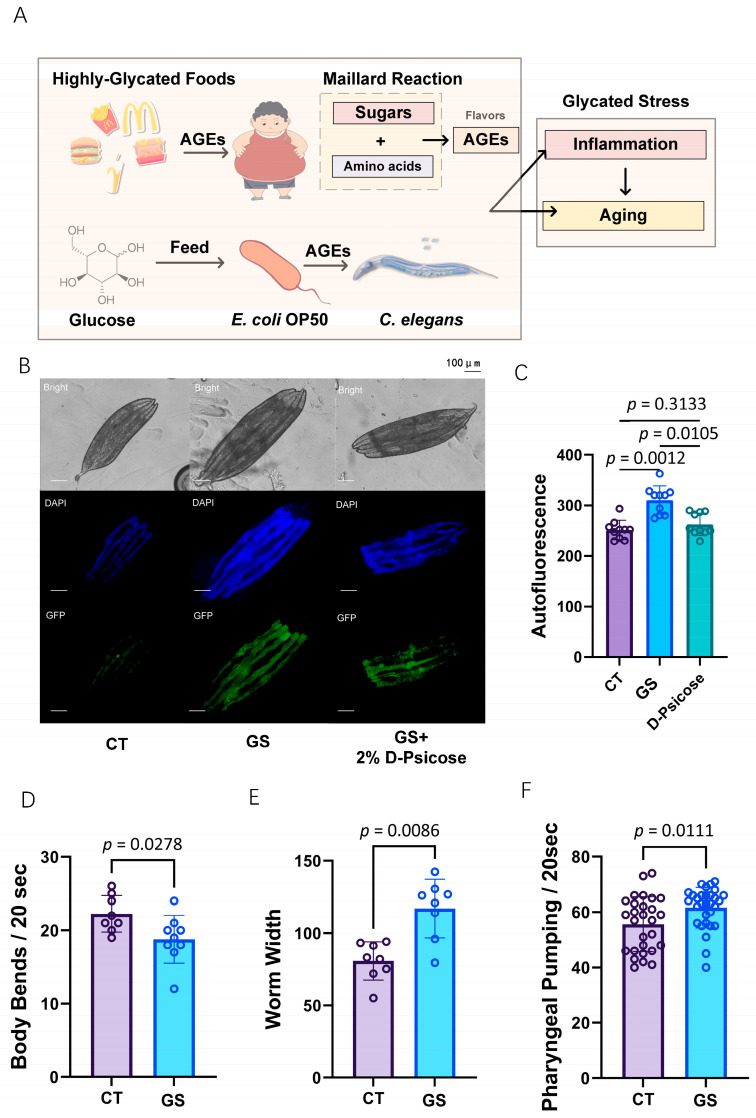
Glycation Stress (GS), induced by advanced glycation end-products (AGEs), significantly impacts aging processes. This study introduces a new model of GS of Caenorhabditis elegans by feeding them Escherichia coli OP50 cultured in a glucose-enriched medium, which better simulates human dietary glycation compared to previous single protein-glucose cross-linking methods. Utilizing WormCNN, a deep learning model, we assessed the health status and calculated the Healthy Aging Index (HAI) of worms with or without GS. Our results demonstrated accelerated aging in the GS group, evidenced by increased autofluorescence and altered gene expression of key aging regulators, daf-2 and daf-16. Additionally, we observed elevated pharyngeal pumping rates in AGEs-fed worms, suggesting an addictive response similar to human dietary patterns. This study highlights the profound effects of GS on worm aging and underscores the critical role of computer vision in accurately assessing health status and aiding in the establishment of disease models. The findings provide insights into glycation-induced aging and offer a comprehensive approach to studying the effects of dietary glycation on aging processes.

Keywords: C. elegans; Convolutional Neural Networks; Glycation Stress; aging; computer vision.


Conflict of interest statement

The authors declare no conflicts of interest.

Figures

Figure 1
Figure 1
U-Net Model Performance and Workflow for Worm Segmentation and Reshaping. (A) The loss curve of the U-Net model during training showed a decrease in loss over 512 epochs. (B) Confusion matrix of the U-Net model. (C) Workflow diagram illustrating the process from original image acquisition to worm reshaping using U-Net segmentation, key points extraction, linear regression for orientation, and final resampling for analysis in WormCNN.
Figure 2
Figure 2
Comprehensive Overview of WormCNN’s Application in Classifying and Predicting the Lifespan of C. elegans. (A) Schematic of the WormCNN architecture showing various layers and their configurations used for processing the worm images. (B) Diagram illustrating the classification model workflow, where reshaped worm images are input into WormCNN to classify worms into elderly and non-elderly categories. (C) Lifespan curve in a 384-well plate showing the survival percentage of worms over time used to define the elderly threshold. The original image data can be found in Supplementary Table S1. (D) The loss curve for the classification model indicates the log-loss reduction as training progresses over epochs. (E) The confusion matrix of the classification model displaying the numbers of true positives, false positives, true negatives, and false negatives. (F) ROC curve illustrating the true positive rate against the false positive rate. (G) Reshaped worm images used in training the WormCNN, with images on the left representing non-elderly worms and those on the right depicting elderly ones. (H) Diagram illustrating the regression model workflow, where WormCNN estimates the actual ages of worms. (I) The loss curve for the regression model showing the decline in training loss, reflecting learning efficiency and model convergence. (J) A scatter plot compares predicted versus true age values, with a regression line indicating the accuracy of the age estimations. In this article, the predicted values are used as the “Healthy Aging Index” (HAI), which quantifies the deviation of each worm’s predicted age from its actual age.
Figure 3
Figure 3
Evaluating the Impact of GS (GS) in C. elegans. (A) Schematic overview showing the formation and impacts of GS and AGEs. This panel depicts the dietary sources of AGEs, the Maillard reaction producing AGEs, and the subsequent GS leading to inflammation and aging in organisms. (B) Representative images of C. elegans under different treatments. The top row shows bright-field images, the middle row features DAPI staining of nuclei, and the bottom row illustrates GFP expression in worms. These images compare to control (CT), GS group, and GS plus 2% D-Psicose fed groups. The scale bar for panel B is 100 μm. (C) Quantification of autofluorescence levels across different groups, demonstrating the reduction of AGE accumulation when D-Psicose is included in the diet. The original data for this panel can be found in Supplementary Table S2. (D) Measurement of body bends per 20 s indicating the locomotor activity of worms under different treatments. The original data for this panel can be found in Supplementary Table S3. (E) Worm width, reflecting potential morphological changes induced by GS and the effect of D-Psicose. The original data for this panel can be found in Supplementary Table S4. (F): Pharyngeal pumping rates over 20 s, highlighting the effects of GS on feeding behavior in C. elegans. The original data for this panel can be found in Supplementary Table S5.
Figure 4
Figure 4
Performance of WormCNN in Classifying and Predicting the Biological Age of C. elegans under Control and GS Conditions. A/B: Panels (A,B) display representative images of C. elegans processed by the WormCNN, illustrating the classification of non-elderly and elderly worms, respectively, under control (CT) and GS (GS) conditions. Error bars represent the standard error of the mean (SEM), and experiments were performed in triplicate. Each image details the predicted biological age, showcasing the model’s accuracy in different experimental setups. (C) Presents the results of RT-qPCR analysis, showing the relative mRNA expression levels of various age-related genes (gst-4, mtl-1, sod-2, sod-3, ugt-44, daf-2, and daf-16) in control versus GS conditions. Statistical significance is indicated, highlighting the impact of GS on gene expression linked to aging. All primers used in the RT-qPCR experiments are listed in Supplementary Table S6. Statistical significance was determined using a two-tailed Student’s t-test for pairwise comparisons. p-values less than 0.05 were considered statistically significant.
Figure 5
Figure 5
Experimental Setup and Imaging of C. elegans. (A) Overview of the laboratory setup showing the microscope, and the 384-well plate used for live imaging of C. elegans. (B) A sequence of images displaying various postures and developmental stages of C. elegans in a 384-well plate. (C) Fluorescent images demonstrating the autofluorescence of the intestinal tract in C. elegans within the liquid culture medium. (D) Close-up view of an individual C. elegans in liquid culture. (E) A detailed fluorescent microscopy image showing intense autofluorescence in the gut of C. elegans.
Figure 6
Figure 6
U-Net architecture for worm segmentation. The network features a contracting path for feature extraction through convolutional layers and downsampling, a bottleneck for high-level feature representation, and an expansive path for upsampling and precise localization, ultimately producing segmented images highlighting the worm’s central line.

Similar articles

Cited by

References

    1. Samanta S., Akhter F., Xue R., Sosunov A.A., Wu L., Chen D., Arancio O., Yan S.F., Yan S.S. Synaptic Mitochondria Gly-cation Contributes to Mitochondrial Stress and Cognitive Dysfunction. [(accessed on 23 July 2024)]. Available online: - DOI - PMC - PubMed
    1. Kumari N., Vaishnav M.S., Srikanta S., Krishnaswamy P.R., Bhat N. Exploring glycated sites in human serum albumin: Impact of sample processing techniques on detection and analysis. Anal. Methods Adv. Methods Appl. 2024;16:5239–5247. doi: 10.1039/D4AY00503A. - DOI - PubMed
    1. Lan J., Huang X., Li H., Lin S., Huang J., Yang W., Ouyang M., Fang J., Xu Q. YTHDF2 Regulates Advanced Glycation End Products-Induced Melanogenesis through Inhibiting A20 Expression in Human Dermal Fibroblasts. [(accessed on 23 July 2024)]; Available online: https://pubmed.ncbi.nlm.nih.gov/39009810/ - PubMed
    1. Awan U.N., Waraich R.S., Nangrejo R., Noor S.S., Siddiqui I.A., Ikram K. RAGE Signalling Contributes to Oxidative Stress and Inflammation in Knee Osteoarthritis Patients with Metabolic Syndrome. [(accessed on 23 July 2024)]; Available online: https://pubmed.ncbi.nlm.nih.gov/39008290/ - PubMed
    1. Takata T., Inoue S., Masauji T., Miyazawa K., Motoo Y. Generation and Accumulation of Various Advanced Glycation End-Products in Cardiomyocytes May Induce Cardiovascular Disease. Int. J. Mol. Sci. 2024;25:7319. doi: 10.3390/ijms25137319. - DOI - PMC - PubMed

MeSH terms

LinkOut - more resources