. 2024 Sep 7;25(17):9693.
doi: 10.3390/ijms25179693.

Functional Analysis of RE1 Silencing Transcription Factor as a Putative Tumor Suppressor in Human Endometrial Cancer

Affiliations

Functional Analysis of RE1 Silencing Transcription Factor as a Putative Tumor Suppressor in Human Endometrial Cancer

Yasmin Abedin et al. Int J Mol Sci. .

Abstract

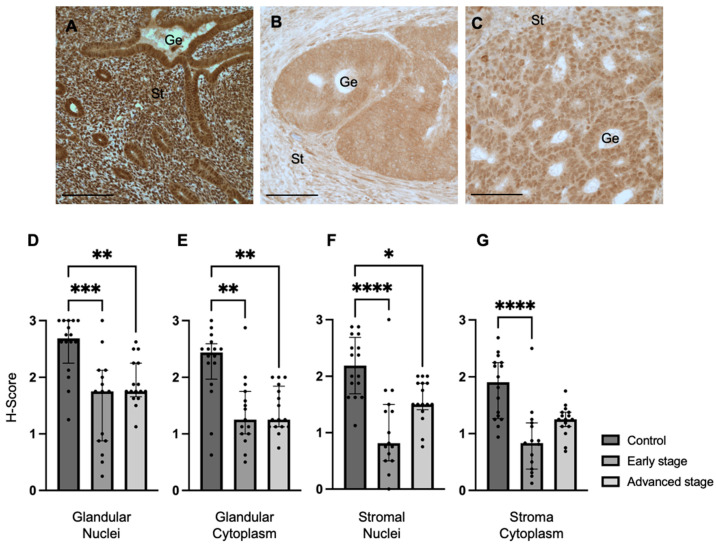
Uterine cancer is the most common gynecologic malignancy in the United States, with endometrioid endometrial adenocarcinoma (EC) being the most common histologic sub-type. Considering the molecular classifications of EC, efforts have been made to identify additional biomarkers that can assist in diagnosis, prognosis, and individualized therapy. We sought to explore the relationship of Repressor Element 1 (RE1) silencing transcription factor (REST), which downregulates neuronal genes in non-neuronal tissue, along with matrix metalloproteinase-24 (MMP24) and EC. We analyzed the expression of REST and MMP24 in 31 cases of endometrial cancer and 16 controls. We then explored the baseline expression of REST and MMP24 in two EC cell lines (Ishikawa and HEC-1-A) compared to a benign cell line (t-HESC) and subsequently evaluated proliferation, migration, and invasion in the setting of loss of REST gene expression. REST and MMP24 expression were significantly lower in human EC samples compared to control samples. REST was highly expressed in EC cell lines, but decreasing REST gene expression increased proliferation (FC: 1.13X, p < 0.0001), migration (1.72X, p < 0.0001), and invasion (FC: 7.77X, p < 0.05) in Ishikawa cells, which are hallmarks of cancer progression and metastasis. These findings elicit a potential role for REST as a putative tumor suppressor in EC.

Keywords: MMP24; REST; endometrial cancer; endometrioid sub-type; gene expression; invasion; migration; proliferation; protein expression.


Conflict of interest statement

The authors declare no conflicts of interest.

Figures

Figure 1
Figure 1
REST expression in control and EC specimens. (AC) Representative images of REST expression in control (N = 16), early-stage (N = 15), and advanced-stage EC (N = 16) localized to the nucleus and cytoplasm of the glandular epithelium (Ge) and stroma (St). REST expression was decreased in early-stage and advanced-stage EC specimens compared to controls in the (D) epithelial glandular nuclei, (E) glandular cytoplasm, and (F) stromal nuclei. REST expression was only decreased in early-stage EC compared to controls in the stromal cytoplasm (G). Data are represented as median with IQR, * p < 0.05, ** p < 0.01, *** p < 0.001, **** p < 0.0001. Scale bars are 100 µm.
Figure 2
Figure 2
MMP24 expression in control and EC specimens. (AC) Representative images of MMP24 expression in control (N = 16), early-stage (N = 15), and advanced-stage EC (N = 16) localized to the nucleus and cytoplasm of the glandular epithelium (Ge) and stroma (St). MMP24 expression was decreased in early-stage and advanced-stage EC specimens compared to controls in the (D) epithelial glandular nuclei, (E) glandular cytoplasm, and (F) stromal nuclei. (G) MMP24 expression was only increased in advanced-stage EC compared to controls in the stromal cytoplasm. Data are represented as median with IQR, * p < 0.05, ** p < 0.01, **** p < 0.0001. Scale bars are 100 µm.
Figure 3
Figure 3
Comparison of REST and MMP24 expression in each cellular localization. REST and MMP24 expression were compared in each cellular localization for controls, early-stage, and advanced-stage EC samples. MMP24 expression was decreased compared to REST expression in the (A) epithelial glandular nuclei, (C) stromal nuclei, and (D) stromal cytoplasm for control, early-stage, and advanced-stage EC samples. There was no difference in MMP24 expression compared to REST expression in the glandular cytoplasm (B). Data are represented as median with IQR, * p < 0.05, ** p < 0.01, *** p < 0.001,**** p < 0.0001.
Figure 4
Figure 4
Comparison of nuclear REST to cytoplasmic MMP24 expression in glands and stroma. (A) When comparing REST nuclear expression to MMP24 cytoplasmic expression within the glands, there was a significant decrease in MMP24 expression only in the control samples, but not in the early-stage or advanced-stage samples. (B) There was a decrease in MMP24 cytoplasmic expression compared to REST nuclear expression in the stroma of controls, early-stage EC, and advanced-stage EC specimens. Data are represented as median with IQR, * p < 0.05, ** p < 0.01, **** p < 0.0001.
Figure 5
Figure 5
REST expression in EC cell lines. Baseline REST expression was increased in Ishikawa and HEC-1-A compared to t-HESC at 24 h (A) and 48 h (B). Data are represented as median with IQR. (C) Representative Western blot images of REST expression for cell lines. Baseline REST protein expression was increased in Ishikawa and HEC-1-A compared to t-HESC at 24 h (D) and 48 h (E). Data are represented as mean with SD, * p < 0.05, ** p < 0.01, *** p < 0.001.
Figure 6
Figure 6
MMP24 expression in EC cell lines. (A,B) Baseline MMP24 gene expression was increased in Ishikawa compared to t-HESC at 24 h and 48 h. MMP24 was decreased in HEC-1-A compared to t-HESC only at 24 h. Data are represented as median with IQR. (C,D) Representative Western blot images of MMP24 expression with multiple bands at 24 h and 48 h. MMP24 can be detected at 73 kDa (blue arrow) as the full-sized band and 55kDa (green arrow) as the active band. Densitometry for the active band showed increased MMP24 expression in HEC-1-A compared to t-HESC at 24 h (E) and 48 h (F). Data are represented as mean with SD, * p < 0.05, *** p < 0.001.
Figure 7
Figure 7
REST and MMP24 gene expression after REST knockdown in EC cell lines. After double transfection using NT and REST siRNA, REST was decreased (A) and MMP24 was increased (B) in Ishikawa cells. In HEC-1-A, REST was decreased (C) but there was no change in MMP24 (D) after the double transfection. Data are represented as mean with SD, ** p < 0.01, **** p < 0.0001.
Figure 8
Figure 8
Impact of REST knockdown on EC cell line proliferation. (A) There was increased proliferation in Ishikawa cells by 1.13-fold after REST was knocked down, represented by normalized OD590 values. (B) There was no change in proliferation in HEC-1-A after REST was knocked down. Data are represented as median with IQR, **** p < 0.0001.
Figure 9
Figure 9
Impact of REST knockdown on EC cell migration. Representative images for scratch assay in Ishikawa cells at 0 h (A,B), 24 h (C,D), and 48 h (E,F). (G) There was a statistically significant increase in relative migration by 1.72-fold in Ishikawa cells after 48 h of REST knockdown. (H) There was also a significant increase in percent wound closure from 13.7% to 21.2% after 48 h. Representative images for scratch assay in HEC-1-A cells at 0 h (I,J), 24 h (K,L), and 48 h (M,N). (O,P) There were no changes in relative migration or percent wound closure in HEC-1-A cells. Data are represented as median with IQR, ** p < 0.01, **** p < 0.0001. Scale bars are 500 µm.
Figure 10
Figure 10
Impact of REST knockdown on EC cell invasion. Representative images of the DAPI-stained (in black and white) invading cells for the trans-well invasion assay for Ishikawa cells (A,B) and HEC-1-A cells (D,E). (C) There was a statistically significant increase in relative invasion by 7.77-fold in Ishikawa cells. (F) There was no change in relative invasion in HEC-1-A cells. Data are represented as median with IQR, * p < 0.05. Scale bars are 100 µm.

References

    1. Siegel R.L., Miller K.D., Wagle N.S., Jemal A. Cancer statistics, 2023. CA Cancer J. Clin. 2023;73:17–48. doi: 10.3322/caac.21763. - DOI - PubMed
    1. Creasman W.T., Odicino F., Maisonneuve P., Quinn M.A., Beller U., Benedet J.L., Heintz A.P.M., Ngan H.Y.S., Pecorelli S. Carcinoma of the Corpus Uteri. Int. J. Gynaecol. Obstet. 2006;95((Suppl. S1)):S105–S143. doi: 10.1016/S0020-7292(06)60031-3. - DOI - PubMed
    1. Setiawan V.W., Yang H.P., Pike M.C., McCann S.E., Yu H., Xiang Y.B., Wolk A., Wentzensen N., Weiss N.S., Webb P.M., et al. Type I and II endometrial cancers: Have they different risk factors? J. Clin. Oncol. 2013;31:2607–2618. doi: 10.1200/JCO.2012.48.2596. - DOI - PMC - PubMed
    1. Felix A.S., Weissfeld J.L., Stone R.A., Bowser R., Chivukula M., Edwards R.P., Linkov F. Factors associated with Type I and Type II endometrial cancer. Cancer Causes Control. 2010;21:1851–1856. doi: 10.1007/s10552-010-9612-8. - DOI - PMC - PubMed
    1. Corr B., Cosgrove C., Spinosa D., Guntupalli S. Endometrial cancer: Molecular classification and future treatments. BMJ Med. 2022;1:e000152. doi: 10.1136/bmjmed-2022-000152. - DOI - PMC - PubMed

Substances

LinkOut - more resources