. 2024 Sep 3;13(17):2468.
doi: 10.3390/plants13172468.

Variation in Root-Associated Microbial Communities among Three Different Plant Species in Natural Desert Ecosystem

Affiliations

Variation in Root-Associated Microbial Communities among Three Different Plant Species in Natural Desert Ecosystem

Yulin Zhang et al. Plants (Basel). .

Abstract

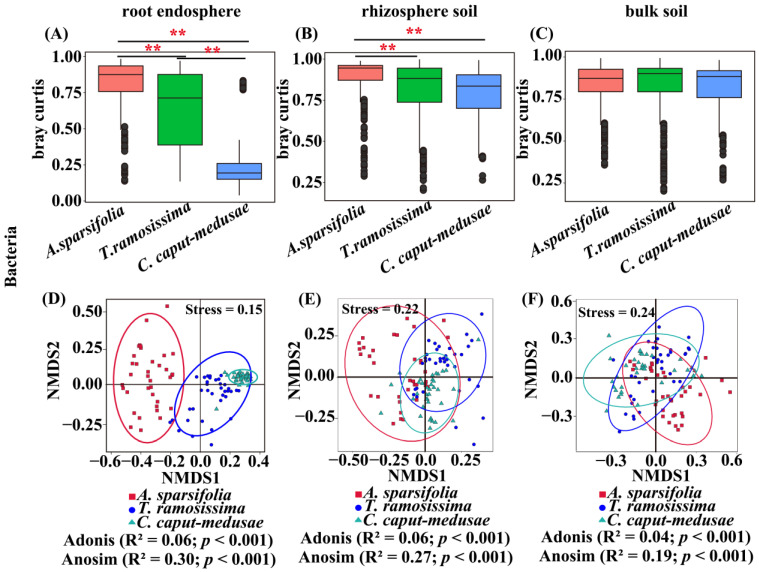
The process and function that underlie the assembly of root-associated microbiomes may be strongly linked to the survival strategy of plants. However, the assembly and functional changes of root-associated microbial communities in different desert plants in natural desert ecosystems are still unclear. Thus, we studied the microbial communities and diversity of root endosphere (RE), rhizosphere soil (RS), and bulk soil (BS) among three representative desert plants (Alhagi sparsifolia, Tamarix ramosissima, and Calligonum caput-medusae) in three Xinjiang desert regions {Taklimakan (CL), Gurbantünggüt (MSW), and Kumtag (TLF)} in China. This study found that the soil properties {electrical conductivity (EC), soil organic carbon (SOC), total nitrogen (TN) and phosphorus (TP), available nitrogen (AN) and phosphorus (AP)} of C. caput-medusae were significantly lower than those of A. sparsifolia and T. ramosissima, while the root nutrients (TN and TP) of A. sparsifolia were significantly higher compared to C. caput-medusae and T. ramosissima. The beta diversity of bacteria and fungi (RE) among the three desert plants was significantly different. The common OTU numbers of bacteria and fungi in three compartments (RE, RS, and BS) of the three desert plants were ranked as RS > BS > RE. The bacterial and fungal (RE) Shannon and Simpson indexes of C. caput-medusae were significantly lower as compared to those of A. sparsifolia and T. ramosissima. Additionally, bacterial and fungal (RE and RS) node numbers and average degree of C. caput-medusae were lower than those found in A. sparsifolia and T. ramosissima. Root and soil nutrients collectively contributed to the composition of root-associated bacterial (RE, 12.4%; RS, 10.6%; BS, 16.6%) and fungal communities (RE, 34.3%; RS, 1.5%; BS, 17.7%). These findings demonstrate variations in the bacterial and fungal populations across different plant species with distinct compartments (RE, RS, and BS) in arid environments. More importantly, the study highlights how much soil and plant nutrients contribute to root-associated microbial communities.

Keywords: arid environments; desert plants; microbial communities; rhizosphere soil; soil nutrients.


Conflict of interest statement

There are no competing interests among the authors.

Figures

Figure 1
Figure 1
The OTU number (bacteria and fungi) and relative abundance {dominant bacteria and fungi taxa (top 10 phyla)} of root endosphere (RE), rhizosphere soil (RS), and bulk soil (BS) in three desert plants. Different lowercase letters (a and b) indicate significant differences among species at the p < 0.05 level (ANOVA and Duncan’s test). (AC) OTUs number of the bacteria, (DF) OTUs number of the fungi, and (G) relative abundance of dominant bacteria and (H) relative abundance of dominant fungi.
Figure 2
Figure 2
Alpha diversity {(AC) Chao1, (DF) Shannon, (GI) Pielou_e, and (JL) Simpson indexes} of root endosphere (RE), rhizosphere soil (RS), and bulk soil (BS) bacteria in three desert plants. Different lowercase letters (a–c) indicate significant differences among species at the p < 0.05 level and the ns indicate no significant differences among species at the p > 0.05 level (ANOVA and Duncan’s test).
Figure 3
Figure 3
Beta diversity {(AC) Bray–Curtis and (DF) nonmetric multidimensional scaling} of root endosphere (RE), rhizosphere soil (RS), and bulk soil (BS) bacteria of three desert plants. ** p < 0.01.
Figure 4
Figure 4
Core and differential microbiota {(AC) OTUs number of the bacteria and (DF) OTUs number of the fungi} of root endosphere (RE), rhizosphere soil (RS), and bulk soil (BS) bacteria and fungi among three desert plants.
Figure 5
Figure 5
Linear discriminant analysis effect size (LEfSe) {(AC) LEfSe analysis of the bacteria and (DF) LEfSe analysis of the fungi} of root endosphere (RE), rhizosphere soil (RS), and bulk soil (BS) bacteria and fungi among three desert plants.
Figure 6
Figure 6
Co-occurrence network {(A,D,G) Network characteristics of the A. sparsifolia, (B,E,H) Network characteristics of the T. ramosissima, and (C,F,I) Network characteristics of the C. caput-medusae} of root endosphere (RE), rhizosphere soil (RS), and bulk soil (BS) bacteria of three desert plants.
Figure 7
Figure 7
The main drivers of different bacterial and fungal communities {root endosphere (RE), rhizosphere soil (RS), and bulk soil (BS)} at the OTU level. The RDA plots show soil and root nutrients that significantly affect bacterial and fungal communities, according to the reduced model with 999 permutations. The results of HP analysis indicated the relative importance of environmental factors (soil and root) on bacterial and fungal communities. The column diagram shows the individual effect of each environmental factor (from hierarchical partitioning). SOC, soil organic carbon (g·kg−1); ROC, root organic carbon (g·kg−1); EC, electrical conductivity (mS·cm−1); TN, total nitrogen (g·kg−1); TP, total phosphorus (g·kg−1); TK, total potassium (g·kg−1); AN, available nitrogen (mg·kg−1); AP, available phosphorus (mg·kg−1); AK, available potassium (mg·kg−1). {(A) Redundancy analysis and (B) HP analysis of the root endosphere, (E) Redundancy analysis and (F) HP analysis of the rhizosphere soil, and (I) Redundancy analysis and (J) HP analysis of the bulk soil} of the bacteria and {(C) Redundancy analysis and (D) HP analysis of the root endosphere, (G) Redundancy analysis and (H) HP analysis of the rhizosphere soil, and (K) Redundancy analysis and (L) HP analysis of the bulk soil} of the fungi. Note: Significance codes, “*” p < 0.05; “**” p < 0.01; “***” p < 0.001.
Figure 8
Figure 8
The three sampling sites at Cele, Turpan, and Mosuowan are located in Tarim Basin, Turpan Basin, and Junggar Basin, respectively.

References

    1. Bulgarelli D., Rott M., Schlaeppi K., van Themaat E.V.L., Ahmadinejad N., Assenza F., Rauf P., Huettel B., Reinhardt R., Schmelzer E., et al. Revealing structure and assembly cues for Arabidopsis root-inhabiting bacterial microbiota. Nature. 2012;488:91–95. doi: 10.1038/nature11336. - DOI - PubMed
    1. Pankaj T., Jan E., Leach S.G.T., Tongmin S., Brajesh K.S. Plant–microbiome interactions: From community assembly to plant health. Nat. Rev. Microbiol. 2020;18:607–621. - PubMed
    1. Gukailin A., Qin W.K., Wang X.D., Yu M., Feng J.G., Han M.G., Zhu B. Linking the rhizosphere effects of 12 woody species on soil microbial activities with soil and root nitrogen status. Rhizosphere. 2023;28:100809
    1. Mueller C.W., Baumert V., Carminati A., Germon A., Holz M., Kögel-Knabner I., Peth S., Schlüter S., Uteau D., Vetterlein D., et al. From rhizosphere to detritusphere-Soil structure formation driven by plant roots and the interactions with soil biota. Soil Biol. Biochem. 2024;193:109396. doi: 10.1016/j.soilbio.2024.109396. - DOI
    1. Hirsch P.R., Mauchline T.H. Who’s who in the plant root microbiome? Nat. Biotechnol. 2012;30:961–962. doi: 10.1038/nbt.2387. - DOI - PubMed

LinkOut - more resources