Review
. 2024 Aug 29;16(17):2458.
doi: 10.3390/polym16172458.

Structural Rheology in the Development and Study of Complex Polymer Materials

Affiliations
Review

Structural Rheology in the Development and Study of Complex Polymer Materials

Sergey O Ilyin. Polymers (Basel). .

Abstract

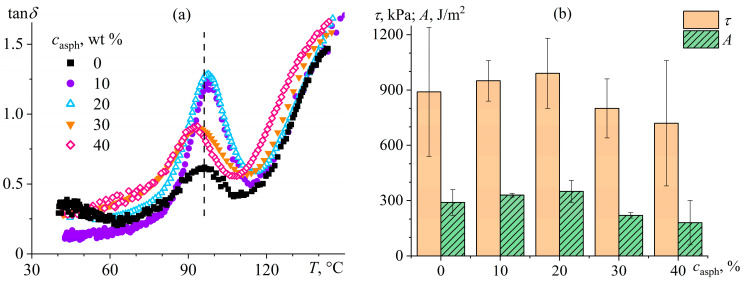
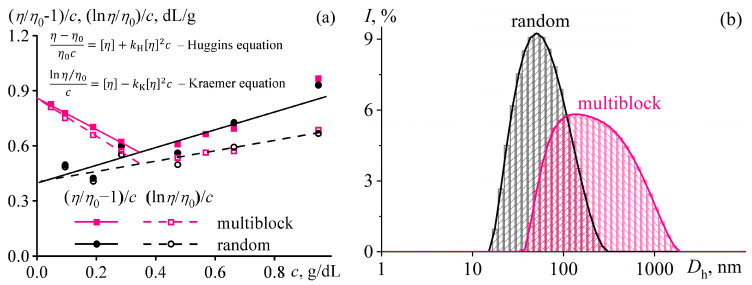
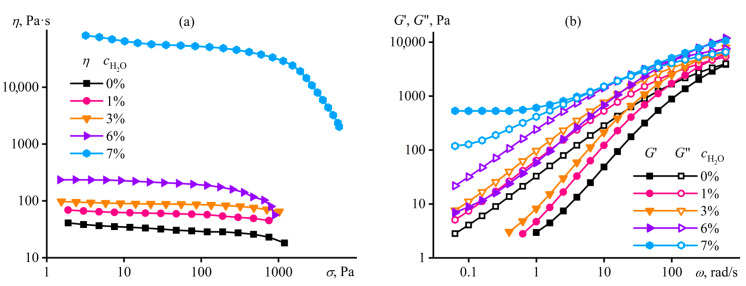
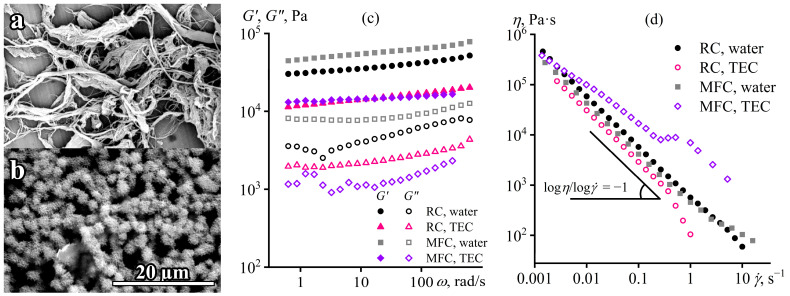
The progress in polymer science and nanotechnology yields new colloidal and macromolecular objects and their combinations, which can be defined as complex polymer materials. The complexity may include a complicated composition and architecture of macromolecular chains, specific intermolecular interactions, an unusual phase behavior, and a structure of a multi-component polymer-containing material. Determination of a relation between the structure of a complex material, the structure and properties of its constituent elements, and the rheological properties of the material as a whole is the subject of structural rheology-a valuable tool for the development and study of novel materials. This work summarizes the author's structural-rheological studies of complex polymer materials for determining the conditions and rheo-manifestations of their micro- and nanostructuring. The complicated chemical composition of macromolecular chains and its role in polymer structuring via block segregation and cooperative hydrogen bonds in melt and solutions is considered using tri- and multiblock styrene/isoprene and vinyl acetate/vinyl alcohol copolymers. Specific molecular interactions are analyzed in solutions of cellulose; its acetate butyrate; a gelatin/carrageenan combination; and different acrylonitrile, oxadiazole, and benzimidazole copolymers. A homogeneous structuring may result from a conformational transition, a mesophase formation, or a macromolecular association caused by a complex chain composition or specific inter- and supramolecular interactions, which, however, may be masked by macromolecular entanglements when determining a rheological behavior. A heterogeneous structure formation implies a microscopic phase separation upon non-solvent addition, temperature change, or intense shear up to a macroscopic decomposition. Specific polymer/particle interactions have been examined using polyethylene oxide solutions, polyisobutylene melts, and cellulose gels containing solid particles of different nature, demonstrating the competition of macromolecular entanglements, interparticle interactions, and adsorption polymer/particle bonds in governing the rheological properties. Complex chain architecture has been considered using long-chain branched polybutylene-adipate-terephthalate and polyethylene melts, cross-linked sodium hyaluronate hydrogels, asphaltene solutions, and linear/highly-branched polydimethylsiloxane blends, showing that branching raises the viscosity and elasticity and can result in limited miscibility with linear isomonomer chains. Finally, some examples of composite adhesives, membranes, and greases as structured polymeric functional materials have been presented with the demonstration of the relation between their rheological and performance properties.

Keywords: chain architecture; gelation; phase separation; polymer blends; polymer composites; polymer gels; polymer solutions; rheology; specific interactions; structure formation.


Conflict of interest statement

The author declares no conflicts of interest.

Figures

Figure 48
Figure 48
The specific viscosity for asphaltenes (Mw = 828 Da) dissolved in diisooctyl sebacate at 25 °C ((a); the inset shows the frequency dependencies of the storage and loss moduli of the solutions) and the viscosity at 120 °C for SIS melts (44% styrene units, 82 kDa) containing asphaltenes (b). The legends indicate asphaltene mass fractions (adapted from [211,219]).
Figure 49
Figure 49
The loss tangent versus temperature for the asphaltene-containing SIS at ω = 6.28 rad/s (a) and the adhesion strength and apparent work of its adhesive bonds with a steel surface upon pull-off at 25 °C (b) (adapted from [219]). The dashed line represents the glass-transition temperature for pure SIS.
Figure 1
Figure 1
Objects of the study.
Figure 2
Figure 2
A generalized flow diagram of materials characterized by Newtonian behavior (1), pseudoplasticity (shear-thinning) typical for polymer melts/concentrated solutions (2) and colloid dispersions (2′), viscoplasticity of non-flowable strong gels (3) and prone-to-creep soft gels (3′), or dilatancy (shear-thickening) (4). The diagram’s right side shows the viscosity ranges inherent to volatile polymer solvents (I); easily flowing liquids such as base oils, plasticizers, and dilute polymer solutions (II); moderately flowing liquids, including oligomers and concentrated polymer solutions (III); poorly flowing liquids such as polymer melts (IV); and systems in a rubbery or glass-like state (V). The top side indicates viscosity drop zones due to the reduction in density of weak van der Waals and supramolecular interactions (a), stronger intermolecular hydrogen bonds and interparticle coagulation contacts (b), and interparticle phase contacts and macromolecular entanglements (c).
Figure 3
Figure 3
Frequency dependencies of storage modulus (G′, solid lines) and loss modulus (G″, dashed lines) of materials showing the behavior of Maxwell viscoelastic liquid (1); Kelvin–Voigt elastoviscous solid (2); solid-like gel (3); or a monodisperse polymer having three relaxation states (4): viscous (zone I, curves are the same as shown for 1), rubbery (II), and glassy (III). Thus, polymer systems have one more relaxation state due to macromolecular entanglements. The inset shows the moduli’s slopes according to the Maxwell model in the terminal (low-frequency) zone. Potentially, any system is liquid-like at low frequencies of external actions (long observation times) and conversely becomes solid-like with an increase in the frequency, as reflected by the Deborah number—the ratio of the relaxation time to the time of the applied action or its observation De = τ/t [76,77].
Figure 4
Figure 4
Normalized responses of polyethylene melt (σ/σ0) to a linear input action, the periodic deformation (γ), according to a harmonic law with different strain amplitudes (γ0) indicated near the curves (adapted from [91]).
Figure 5
Figure 5
Lissajous figures with linear ((a), γ0 = 100%) and nonlinear ((b), γ0 = 1000%) responses of polyethylene melt (adapted from [91]).
Figure 6
Figure 6
Amplitude dependencies of storage modulus (G′, solid lines) and loss modulus (G″, dashed lines) for Maxwell’s (1), viscoplastic (2), and dilatant (3) media. The vertical dashed lines represent the limit of the linear viscoelasticity region for different systems (γ0 where G′(γ0) ≠ const): smaller for structured colloids and longer for homogeneous polymeric and glass-forming liquids.
Figure 7
Figure 7
Storage and loss moduli versus angular frequency (a) and viscosity versus shear stress (b) at 170 °C: polyisoprene (1; 65 kDa), polystyrene (5; 184 kDa), and SIS containing 13 (2; 144 kDa, 12 nm), 18 (3; 140 kDa, 10 nm), or 44 wt% of styrene units (4; 82 kDa, 5 nm). The values in parentheses represent the number-average molecular weight (Mn) and diameter or thickness of polystyrene domains (according to [103]). Schematic SIS microstructures are in the middle.
Figure 8
Figure 8
Frequency dependencies of storage and loss moduli measured at different temperatures and normalized to 120 °C for random (a) and multiblock (b) vinyl acetate/vinyl alcohol equimolar copolymers having polymerization degrees of 450. Viscoelastic regions represent terminal zone (I), rubbery plateau (II), glass transition (III), and glassy state (IV). The time–temperature superposition principle works well since the curves overlap (a), and vice versa (b). Insets show schematically intermolecular hydrogen bonds—simultaneously intra- and inter-chain (a) and predominantly inter-chain cooperative (b) (adapted from [104,105]).
Figure 9
Figure 9
Concentration dependencies of the reduced viscosity of vinyl acetate/vinyl alcohol equimolar copolymers in DMF at 20 °C in the coordinates of the Huggins and Kraemer equations (a) and the size distribution of copolymer macromolecules and their associates by light scattering intensity in the solutions with copolymer concentrations of 0.28 g/dL (b) (adapted from [105]). The reduced viscosity for the random copolymer decreases with dilution (a), as for a usual polymer in its solution, whereas it goes through a minimum for the multiblock copolymer and then increases because of the growing size of the macromolecular associates, which are less likely to break down through mutual hydrodynamic action when their concentration becomes lower. The macromolecular association of the multiblock copolymer appears evident from the much larger sizes of its diffusing formations (b) consisting of dozens of individual chains.
Figure 10
Figure 10
Interchain interactions of random (a) and multiblock (b) vinyl acetate/vinyl alcohol copolymers in N,N-dimethylformamide (adapted from [105]).
Figure 11
Figure 11
Temperature dependencies of viscosity for 5% solutions of equimolar vinyl acetate/vinyl alcohol copolymers in DMF at 100 s−1 (a) (the inset shows dependencies of viscosity on shear stress for these solutions at −20 °C) and shear stress dependencies of viscosity for 10% solutions of the same copolymers in DMF at 20 °C (b) (adapted from [105]). The viscosity of the random copolymer in its semi-dilute solution increases smoothly upon cooling, like for a usual polymer (a). In contrast, the viscosity rises in a jump-like manner for the multiblock copolymer because of the transition of its solution to the gel state, i.e., the arising of a yield stress of substantial value compared to the negligibly low yield stress of the weakly structured solution of the random copolymer (σY of 19 Pa vs. of 0.012 Pa at −20 °C, see the inset). The transition to concentrated solutions (b) makes multiblock macromolecules metastable—non-flowable at low shear stresses and phase-separable at high ones, unlike the random copolymer having a nearly constant viscosity in the solution.
Figure 12
Figure 12
Shear stress dependencies of viscosity (a,b) and frequency dependencies of storage and loss moduli (c,d) for solutions of acrylonitrile homo- (a,c) and terpolymer (b,d) in DMSO at 20 °C. The polymer mass fraction is indicated at the curves or in the legend (adapted from [120,121]). The homopolymer in its solution exhibits non-Newtonian behavior only at high shear stresses and high concentrations (a), like an ordinary polymer, also showing the usual Maxwell viscoelasticity (c). In contrast, the terpolymer in solution changes behavior from the standard pseudoplasticity of a concentrated polymer solution to anomalous viscoplasticity typical for gels when its content declines (b), just as its viscoelasticity transforms from a Maxwellian liquid to a gel-like state upon dilution (d).
Figure 12
Figure 12
Shear stress dependencies of viscosity (a,b) and frequency dependencies of storage and loss moduli (c,d) for solutions of acrylonitrile homo- (a,c) and terpolymer (b,d) in DMSO at 20 °C. The polymer mass fraction is indicated at the curves or in the legend (adapted from [120,121]). The homopolymer in its solution exhibits non-Newtonian behavior only at high shear stresses and high concentrations (a), like an ordinary polymer, also showing the usual Maxwell viscoelasticity (c). In contrast, the terpolymer in solution changes behavior from the standard pseudoplasticity of a concentrated polymer solution to anomalous viscoplasticity typical for gels when its content declines (b), just as its viscoelasticity transforms from a Maxwellian liquid to a gel-like state upon dilution (d).
Figure 13
Figure 13
Interactions between acrylonitrile/sodium itaconate copolymer macromolecules in anhydrous DMSO (a) or the same solution in the presence of water (b) (adapted from [121]).
Figure 14
Figure 14
Viscosity vs. shear stress (a) and storage and loss moduli vs. angular frequency (b) for 18% solutions of acrylonitrile terpolymer in water-containing DMSO at 20 °C. The legends indicate the water mass fraction in the solutions (adapted from [120,121]).
Figure 15
Figure 15
Steady-state viscosity and complex viscosity (a) at 20 °C as functions of shear rate and angular frequency, respectively, and the storage modulus (b) as a function of temperature during heating or cooling (directions indicated by arrows) for solutions of the acrylonitrile terpolymer in DMSO. The terpolymer mass fraction and water presence are near the curves (adapted from [120,121]).
Figure 16
Figure 16
Thermograms of acrylonitrile terpolymer (PAN) and its 5% solutions in DMSO with different water mass fractions (a) and optical transparency of these solutions compared to DMSO at 20 °C (b) (adapted from [99,120]).
Figure 17
Figure 17
Viscosity as a function of shear stress (a) and storage and loss moduli as functions of angular frequency (b) at 25 °C for 14% cellulose solutions in [EMIM]Ac containing DMSO whose mass fraction in the solvent is near the curves or in the legend (adapted from [130]).
Figure 18
Figure 18
Viscosity vs. shear stress (a) and storage and loss moduli vs. angular frequency (b) for 14% cellulose solutions at 25 °C in [EMIM]Ac containing water whose mass fraction is near the curves or in the legend (adapted from [130]).
Figure 19
Figure 19
Synthesis scheme for sodium salts of poly(1,3,4-oxadiazole-2,5-diyl-3-sulfo-1,4-phenyleneoxy-2-sulfo-1,4-phenylene) (P0), poly(1,3,4-oxadiazole-2,5-diyl-6-sulfo-10,10-dioxophenoxathiine-2,8-diyl) (P100), and their copolymers (P25, P50, and P75).
Figure 20
Figure 20
Viscosity as a function of shear stress (a) and storage and loss moduli as functions of angular frequency (b) for solutions of oxadiazole copolymers in an equivolume DMSO/FA mixture at 25 °C. Copolymers P0 and P25 are insoluble (adapted from [137]).
Figure 21
Figure 21
Specific viscosity of oxadiazole copolymers in an equivolume mixture of DMSO/FA (a) or DMSO/FA/water (b) at 25 °C. The insets show microphotographs of mesophases in crossed polarizers (3.5× magnification) (adapted from [137]).
Figure 22
Figure 22
Viscosity as a function of shear stress (a) and storage and loss moduli as functions of angular frequency (b) for polyoxadiazole solutions in an equivolume DMSO/FA/water mixture at 25 °C (adapted from [137]).
Figure 23
Figure 23
Storage modulus vs. temperature at an angular frequency of 6.28 rad/s (a) and viscosity vs. shear stress at 14 °C (b) for gelatin hydrogels (100 kDa, 1 wt%) containing κ-carrageenan (680 kDa), whose mass fraction is in the legends (adapted from [145]).
Figure 24
Figure 24
Storage and loss moduli versus angular frequency for gelatin, κ-carrageenan, and their combined hydrogels at 14 °C (a) and the transformation of intermolecular interactions of gelatin macromolecules in the presence of κ-carrageenan with an example of glycine and hydroxyproline units (b). Dashed lines represent hydrogen, ion–dipole, and ionic bonds (adapted from [145]).
Figure 25
Figure 25
Viscosity versus temperature at a shear rate of 10 s−1 (a) or versus shear stress at 25 °C (b) for acetyl tributyl citrate (ATBC) containing cellulose acetobutyrate (CAB), whose mass fraction is near the curves (adapted from [146]). The viscosity of the pure ATBC grows smoothly upon cooling, whereas the viscosity of the CAB/ATBC solution rises in a step-like manner at 55 °C because of gel formation (a) manifesting itself in a yield stress behavior, where the yield stress value becomes higher with an increase in the CAB mass fraction (b).
Figure 26
Figure 26
Frequency dependencies of storage and loss moduli for CAB/ATBC gels of different compositions at 25 °C (a) and at different temperatures and a 10% CAB mass fraction (b) (adapted from [146]). Higher CAB content (a) and cooling (b) elevate gels’ stiffness, but only a temperature as low as −80 °C and high applied frequencies cause their notable mechanical glass transition, i.e., an increase in the moduli upon a rise in angular frequency, indicating a rubbery-like state of the gels at higher temperatures.
Figure 27
Figure 27
Complex viscosity of a 5% solution of benzimidazole copolymer in DMA as a function of temperature at an angular frequency of 6.28 rad/s, a strain amplitude of 10%, and the heating rate indicated in °C/min near the curves (a), as well as the temperature of the phase separation of this solution as a function of the heating rate (b) (adapted from [100]).
Figure 28
Figure 28
Viscosity of a 5% solution of benzimidazole copolymer in DMA as a function of temperature at a heating rate of 10 °C/min and a shear stress indicated in Pa near the curves (a), as well as the temperature of the phase separation of this solution as a function of the shear stress (b). The inset shows the increase in the phase separation temperature under shear action (adapted from [100]).
Figure 29
Figure 29
Storage and loss moduli as functions of strain amplitude for a 20% solution of acrylonitrile terpolymer in DMSO at an angular frequency of 6.28 rad/s and 20 °C, as well as photographs of the solution after testing with strains of 1600% ((a), zone I of macromolecular orientation), 4000% ((b), zone II of phase separation), and 250,000% ((c,d), zone III of wall slip) (adapted from [99]).
Figure 30
Figure 30
Viscosity as a function of shear stress (a) and storage and loss moduli as a function of angular frequency (b) for a 3 vol% dispersion of fumed silica (7 nm, 388 m2/g) in DMSO containing polyethylene oxide (40 kDa) whose mass fraction is indicated near the curves and in the legend. The SiO2 dispersion and 0.1–10% PEO solutions do not demonstrate viscoelasticity separately. T = 50 °C, preventing crystallization of PEO. The inset shows a schematic change in the structure of the SiO2 dispersion in the presence of PEO (adapted from [155]).
Figure 31
Figure 31
Viscosity as a function of shear stress (a) and storage and loss moduli as a function of angular frequency (b) for a 1% aqueous solution of polyethylene oxide (3 MDa), a 15% aqueous dispersion of bentonite (75 µm, 58 m2/g), and their combination at 25 °C. The inset shows a schematic change in the structure of the bentonite dispersion in the presence of PEO (adapted from [156]).
Figure 32
Figure 32
Viscosity as a function of shear stress at 25 °C for a 1% aqueous PEO solution containing different bentonite mass fractions (a) and a 15% aqueous bentonite dispersion containing different PEO mass fractions (b) in comparison with the initial bentonite-free PEO solutions (adapted from [156]).
Figure 33
Figure 33
Viscosity versus the shear rate at 25 °C for 10% CAB/ATBC gels containing boron nitride (a), graphite (b), or PTFE (c) and a scheme of transforming the initial gel structure (d) with the formation of an additional particle network (e), destruction of the polymer network with the formation of a particle network (f), or the action of particles as inactive fillers (g) (adapted from [146]).
Figure 33
Figure 33
Viscosity versus the shear rate at 25 °C for 10% CAB/ATBC gels containing boron nitride (a), graphite (b), or PTFE (c) and a scheme of transforming the initial gel structure (d) with the formation of an additional particle network (e), destruction of the polymer network with the formation of a particle network (f), or the action of particles as inactive fillers (g) (adapted from [146]).
Figure 34
Figure 34
Viscosity versus shear stress (a) and storage and loss moduli versus angular frequency (b) at 20 °C for an adhesive mixture of poly(iso)butylenes (40% 4.5 kDa, 50% 51 kDa, and 10% 1.1 MDa) containing pyrogenic silica particles (20 nm, 175 m2/g) whose mass fraction is indicated near the curves or in the legend (adapted from [157]).
Figure 35
Figure 35
Viscosity versus shear rate for 7% SiO2 dispersions (7 nm, 388 m2/g) in PEO melts having different molecular weights (indicated near the curves) at 120 °C (a) and the relative viscosity of 3% SiO2 dispersions in PEO (400 Da) at 20 °C versus particles’ specific surface area and size (b) (adapted from [162]).
Figure 36
Figure 36
Schematic diagram of the rheological state for dispersions of particles in polymer media depending on their size and volume fraction and the polymer’s molecular weight (adapted from [162]).
Figure 37
Figure 37
SEM images of (a) microfibrillated cellulose (MFC) and (b) regenerated cellulose (RC), (c) dependencies of storage and loss moduli on the angular frequency for their 3% hydro- and organogels, and (d) the viscosity curves of these gels (adapted from [168,169,170]).
Figure 38
Figure 38
Yield stress of gels versus nanocellulose content (a) and temperature dependencies of viscosity for two organogels compared to pure TEC (b) (adapted from [168,169,170]).
Figure 39
Figure 39
Structural formulas of PBAT and polyfunctional comonomers (a) and shear stress dependencies of the viscosity (b), the first normal stress difference (b), and the relative elasticity coefficient (c) for PBAT melts at 190 °C. The legends indicate the comonomers’ number (adapted from [176]).
Figure 40
Figure 40
Structural formulas of pre-catalysts (a) and dependencies of storage and loss moduli at 150 °C on the angular frequency (b) and each other (c) for polyethylenes synthesized at 80 °C with the involvement of the specified pre-catalysts (adapted from [179]).
Figure 41
Figure 41
Continuous relaxation spectra for PE melts at 150 °C (a) and their highest Newtonian viscosity versus GPC-measured molecular weight (b). The pre-catalysts and synthesis temperatures are indicated in the legend and near the experimental points. The arrows show long-time shoulders associated with long-chain branching. The dashed line reflects the calculated viscosity for linear PE (adapted from [179]).
Figure 42
Figure 42
Viscosity versus shear stress for aqueous solutions of sodium hyaluronate at 25 °C (a) and its gels (b) obtained using BDDE (BDDE/SH = 1/90 wt/wt; 5 mol% disaccharide units contain cross-links) (adapted from [184,185]).
Figure 43
Figure 43
Storage and loss moduli versus angular frequency for the solution of sodium hyaluronate and its two gels (a) and the concentration dependencies of their specific viscosity (γ˙ = 0.001 s−1) and yield stress (b) (adapted from [184,185]). Captions near the concentration dependencies indicate their slopes. The inset demonstrates an example of sodium hyaluronate’s cross-linked microgels stained with toluidine blue (adapted from [186]).
Figure 44
Figure 44
Phase diagrams for linear/highly-branched siloxane blends ((a), UCST is indicated near the curves) and their viscosity as a function of temperature at ML/MHB = 166/12 kDa/kDa ((b), the inset shows the viscosity versus shear stress at 20 °C). The legends indicate molecular weight ratios (a) and volume fraction of highly branched macromolecules (b) (adapted from [187,189]).
Figure 45
Figure 45
Dependencies of the viscosity of linear/highly-branched siloxane blends on the temperature at ML/MHB = 166/7.2 kDa/kDa ((a); the inset shows the viscosity versus shear stress at 0 °C) and the calculations of the blend viscosity at the linear variations of the parameters indicated near the curves, the transition from linear macromolecules to highly branched ones, and 0 °C (b) (adapted from [189]).
Figure 46
Figure 46
Generalized scheme of structure formation in macromolecular systems.
Figure 47
Figure 47
The viscosity of the poly(iso)butylene-based pressure-sensitive adhesives as a function of the volume fraction of dispersed particles (a) and the increase in time to failure of adhesive bonds of these adhesives with steel as a function of their viscosity at 25 °C (b) (adapted from [157,202,203,204]).
Figure 50
Figure 50
Permeability of DMF and retention coefficient for a model pollutant (Remazol Brilliant Blue R, 626 g/mol) when using cellulose nanofiltration membranes ((a), the precipitant and solvent are on the abscissa scale) and the electrical conductivity of polyoxadiazole films versus their sulfonation degree and the type of cation (b) (adapted from [130,137]).
Figure 51
Figure 51
Friction and wear coefficients when testing lubricating greases based on TEC and nanocellulose (a) or ATBC and cellulose acetate butyrate (b) at 25 °C and a contact pressure of 1910 MPa. The cellulose-based thickener mass fraction and the presence of solid particles are indicated on the abscissa scale. Data for Litol and SVEM greases are provided for comparison (adapted from [146,168,169,227]).

References

    1. Pomogailo A.D. Hybrid Polymer-Inorganic Nanocomposites. Russ. Chem. Rev. 2000;69:53–80. doi: 10.1070/RC2000v069n01ABEH000506. - DOI
    1. Gerasin V.A., Antipov E.M., Karbushev V.V., Kulichikhin V.G., Karpacheva G.P., Talroze R.V., Kudryavtsev Y.V. New Approaches to the Development of Hybrid Nanocomposites: From Structural Materials to High-Tech Applications. Russ. Chem. Rev. 2013;82:303–332. doi: 10.1070/RC2013v082n04ABEH004322. - DOI
    1. Fu S., Sun Z., Huang P., Li Y., Hu N. Some Basic Aspects of Polymer Nanocomposites: A Critical Review. Nano Mater. Sci. 2019;1:2–30. doi: 10.1016/j.nanoms.2019.02.006. - DOI
    1. Beyer V.P., Kim J., Becer C.R. Synthetic Approaches for Multiblock Copolymers. Polym. Chem. 2020;11:1271–1291. doi: 10.1039/C9PY01571J. - DOI
    1. Baeza G.P. Recent Advances on the Structure–Properties Relationship of Multiblock Copolymers. J. Polym. Sci. 2021;59:2405–2433. doi: 10.1002/pol.20210406. - DOI

LinkOut - more resources