

Feasibility and Reproducibility of Isokinetic Dynamometry in Children with Neuromuscular Diseases
- PMID: 39274499
- PMCID: PMC11396260
- DOI: 10.3390/jcm13175285
Feasibility and Reproducibility of Isokinetic Dynamometry in Children with Neuromuscular Diseases
Abstract
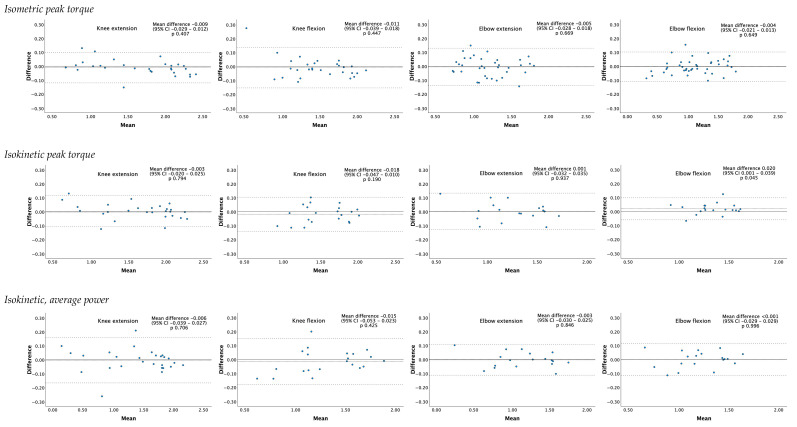
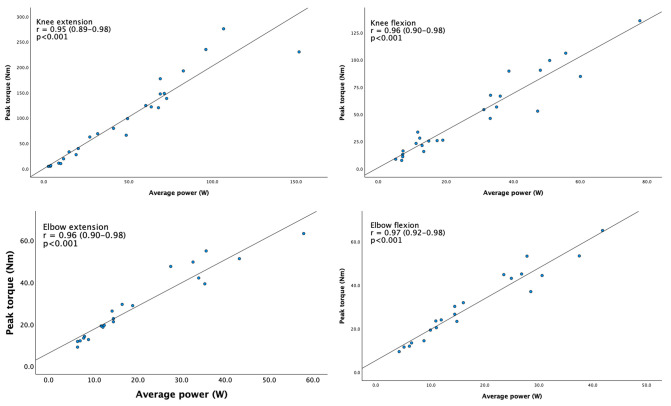
Background/Objectives: High-precision measurement tools are needed to measure relevant changes in strength and power in children with neuromuscular diseases. The aim of this study was to determine the feasibility (i), reproducibility (ii), and validity (iii) of isokinetic dynamometry in this population. Methods: Isometric and isokinetic knee and elbow flexion and extension were measured twice on the same day. Feasibility was based on completion rate and acceptability. Acceptability was measured with a 100 mm visual analog scale. We measured reproducibility as the intraclass correlation coefficient (ICC-agreement), standard error of measurement (SEM), and smallest detectable change (SDC). We investigated relationships between isometric strength and isokinetic power with Pearson's correlation coefficient. ROC curves were used to determine the cutoff of isometric strength to conduct isokinetic measurements. Results: Fifty children with NMDs participated with completion rates of 78-90% for isometric and 39-75% for isokinetic measurements. Acceptability was high (mean (SD) = 73 (19) mm). The ICCs for all measurements were over 0.9 (95% confidence interval (CI) = 0.932-0.998). The SEM% ranged from 5 to 14% and the SDC% from 14 to 28%. The correlations of strength and power were high (Pearson's correlation coefficient >0.9 (95% CI: 0.89-0.98)). The isometric strength needed to conduct isokinetic measurements ranged from 11.1 N in elbow flexors to 24.9 N in knee extensors. Conclusions: Isokinetic dynamometry is a feasible and reproducible method for measuring isometric strength in children with neuromuscular diseases with moderate weakness to normal strength, and isokinetic measurements are only feasible in knee extension for children with moderate weakness to normal strength. The convergent validity between isometric strength and power at low velocities is high.
Keywords: children; isokinetic dynamometry; neuromuscular diseases; power; strength.
Conflict of interest statement
Danny R. van der Woude’s employer receives fees for SMA-related consultancy activities. Tim Takken has no conflicts of interest. Thijs Ruyten’s employer receives fees for SMA-related consultancy activities. Fay-Lynn Asselman’s employer receives fees for SMA-related consultancy activities. Ruben P.A. van Eijk has no conflicts of interest. W. Ludo van der Pol received research grants from Prinses Beatrix Spierfonds and Stichting Spieren voor Spieren, both non-profit foundations. His employer receives fees for SMA-related consultancy activities. Bart Bartels received research grants from Prinses Beatrix Spierfonds, Stichting Spieren voor Spieren, and Piet Poortmanfonds, all non-profit foundations. His employer receives fees for SMA-related consultancy activities.
Figures
References
-
- Wadman R.I., Wijngaarde C.A., Stam M., Bartels B., Otto L.A.M., Lemmink H.H., Schoenmakers M.A.G.C., Cuppen I., van den Berg L.H., van der Pol W.L. Muscle Strength and Motor Function throughout Life in a Cross-Sectional Cohort of 180 Patients with Spinal Muscular Atrophy Types 1c–4. Eur. J. Neurol. 2018;25:512–518. doi: 10.1111/ene.13534. - DOI - PubMed
-
- Mcdonald C.M., Henricson E.K., Abresch R.T., Florence J.M., Eagle M., Gappmaier E., Glanzman A.M., Spiegel R., Barth J., Elfring G., et al. THE 6-Minute Walk Test and Other Endpoints in Duchenne Muscular Dystrophy: Longitudinal Natural History Observations over 48 Weeks from a Multicenter Study. Muscle Nerve. 2013;48:343–356. doi: 10.1002/mus.23902. - DOI - PMC - PubMed
-
- Wang L.H., Shaw D.W.W., Faino A., Budech C.B., Lewis L.M., Statland J., Eichinger K., Tapscott S.J., Tawil R.N., Friedman S.D. Longitudinal Study of MRI and Functional Outcome Measures in Facioscapulohumeral Muscular Dystrophy. BMC Musculoskelet. Disord. 2021;22:262. doi: 10.1186/s12891-021-04134-7. - DOI - PMC - PubMed
-
- Hislop H.J. Daniels & Worthinghams Muscle Testing: Techniques of Manual Examination. 8th ed. Saunders Elsevier; St. Louis, MO, USA: 2007.
LinkOut - more resources
Full Text Sources
