Randomized Controlled Trial
. 2024 Sep 2;16(17):2946.
doi: 10.3390/nu16172946.

Promotion of a Mediterranean Diet Alters Constipation Symptoms and Fecal Calprotectin in People with Parkinson's Disease: A Randomized Controlled Trial

Affiliations
Randomized Controlled Trial

Promotion of a Mediterranean Diet Alters Constipation Symptoms and Fecal Calprotectin in People with Parkinson's Disease: A Randomized Controlled Trial

Carley Rusch et al. Nutrients. .

Abstract

Parkinson's disease is associated with gastrointestinal (GI) dysfunction, including constipation symptoms and abnormal intestinal permeability and inflammation. A Mediterranean diet (MediDiet) may aid in disease management. This parallel, randomized, controlled trial in people with Parkinson's (PwP) and constipation symptoms compared a MediDiet against standard of care on change in constipation symptoms, dietary intake, and fecal zonulin and calprotectin concentrations as markers of intestinal permeability and inflammation, respectively. Participants were randomized to either standard of care for constipation (control; n = 17, 65.1 ± 2.2 years) or a MediDiet plus standard of care (n = 19, 68.8 ± 1.4 years) for 8 weeks. Constipation scores decreased with both interventions (p < 0.01), but changes from baseline were not different between groups (MediDiet, -0.5 [-1.0, 0]; control, -0.8 [-1.0, 0.2]; median [25th, 75th]; p = 0.60). The MediDiet group had a higher intake of dietary fiber at week 4 than the control group (13.1 ± 0.7 g/1000 kcal vs. 9.8 ± 0.7 g/1000 kcal; p < 0.001). No differences in fecal zonulin were observed between groups (p = 0.33); however, fecal calprotectin tended to be lower in the MediDiet group at week 8 (45.8 ± 15.1 µg/g vs. 93.9 ± 26.8 µg/g; p = 0.05). The MediDiet and standard interventions reduced constipation symptoms; however, the MediDiet provided additional benefit of increased dietary fiber intake and less intestinal inflammation.

Keywords: Mediterranean diet; Parkinson’s disease; constipation; inflammation; microbiota.


Conflict of interest statement

C.R. is now an employee of Abbott’s Nutrition Division, Columbus, OH, 43219, USA, and T.S. is employed by the Department of Neurology, Weill Institute for Neurosciences. University of California, San Francisco, San Francisco, CA, 94143-3126, USA; however, this work was completed while affiliated with the University of Florida. All other authors have no conflicts of interest to declare.

Figures

Figure 1
Figure 1
Participant flow diagram for the main study. Due to the coronavirus pandemic, 11 participants (n = 3 control group and n = 8 MediDiet group) completed study procedures virtually. Abbreviations: ITT, intent-to-treat; MEDAS, Mediterranean diet adherence screener; MediDiet, Mediterranean diet; PP, per protocol.
Figure 2
Figure 2
Mediterranean diet adherence by study week from the 14-Item Mediterranean Diet Adherence Screener (scores from 10 to 14 denote good adherence). The interaction of group and week was significant for both intent-to-treat ((A), p = 0.002) and per protocol ((B), p < 0.0001). A general linear mixed model was used to analyze scores. Covariates were tested in the full model, and nonsignificant covariates were removed hierarchically, beginning with interactions with the largest p-values. p-values were adjusted using the post hoc Tukey–Kramer method for multiple comparisons. *** p-value < 0.001 MediDiet vs. control groups at specified week. ††† p-value < 0.001 compared to week 0 in the MediDiet group. Values are least squares means ± SEM. Abbreviations: MEDAS, Mediterranean diet adherence screener; MediDiet, Mediterranean diet.
Figure 3
Figure 3
Constipation syndrome scores from the Gastrointestinal Symptom Rating Scale decreased in both groups (p < 0.05) over the 8-week intervention. The constipation symptoms (constipation, hard stools, and the feeling of incomplete evacuation) are scored as 1 = no discomfort to 7 = very severe discomfort, with constipation syndrome representing the mean symptoms score. Data did not meet the assumptions of normality, and Mann–Whitney U tests were used. No differences between groups were observed for intent-to-treat ((A), p = 0.600) or per protocol ((B), p = 0.147) analyses. Median scores are represented by the line within each boxplot. Abbreviations: MediDiet, Mediterranean diet.
Figure 4
Figure 4
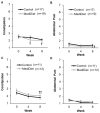
Syndrome scores from the Gastrointestinal Symptom Rating Scale by study week in the intent-to-treat (A,B) and per protocol analyses (C,D). The constipation syndrome score (A,C) includes constipation, hard stools, and the feeling of incomplete evacuation. The abdominal pain syndrome score (B,D) includes abdominal pain, hunger pains, and nausea. Symptom scores range from 1 = no discomfort to 7 = very severe discomfort, with syndrome scores representing the mean symptom score. A generalized linear mixed model was used for analyses. Covariates were tested in the full model, and nonsignificant covariates were removed hierarchically, beginning with interactions with the largest p-values. Study week was significant for constipation ((A), p = 0.007; (C), p = 0.002) and abdominal pain ((B), p = 0.003; (D), p = 0.036) syndrome scores. Abdominal pain syndrome scores differed with the level of physical activity for intent-to-treat analyses ((B), p = 0.018) and were included as a covariate. p-values were adjusted using the post hoc Tukey–Kramer method for multiple comparisons. p-value < 0.05 compared to week 0 in the MediDiet group. †† p-value < 0.01 compared to week 0 in the MediDiet group. Scores were log-transformed for analyses to meet the assumptions of normality. Values are presented as untransformed least squares means ± SEMs. Abbreviations: MediDiet, Mediterranean diet.
Figure 5
Figure 5
Dietary fiber intake density by study week as measured by the Automated Self-Administered 24-h recall. A general linear mixed model was used to analyze scores for ITT (A) and PP (B) analyses. Covariates were tested in the full model, and nonsignificant covariates were removed hierarchically, beginning with interactions with the largest p-values. The final model for the included group (p = 0.056), week (p < 0.0001), and interaction of group and week (p = 0.0007) for ITT analyses (A). For PP analyses (B), the final model included group (p = 0.553), week (p = 0.0002), and interaction of group and week (p = 0.0006) and was adjusted using post hoc Tukey–Kramer method for multiple comparisons. * p-value < 0.05 MediDiet vs. control groups at specified week. †† p-value < 0.01 compared to week 0 in the MediDiet group. ††† p-value < 0.001 compared to week 0 in the MediDiet group. Values are least squares means ± SEM of 4, 24-h recalls (2 weekday, 2 weekend) for each time point. Abbreviations: ITT, intent-to-treat; MediDiet, Mediterranean diet; PP, per protocol.
Figure 6
Figure 6
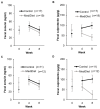
Fecal zonulin and calprotectin concentrations by study week in the intent-to-treat (A,B) and per protocol analyses (C,D). A generalized linear mixed model was used with log-transformed values, including only weeks 4 and 8 for analyses. Covariates were tested in the full model, and nonsignificant covariates were removed hierarchically, beginning with interactions with the largest p-values. Baseline values (week 0) were included as a covariate in final models and are shown as open circles and squares for the control and MediDiet groups, respectively. Baseline was compared using the Mann–Whitney U test and was not different between groups for fecal zonulin ((A), p = 0.609; (C), p = 0.56) or calprotectin ((B), p = 0.72; (D), p = 0.88). The interaction for study group was significant for fecal calprotectin during the study intervention ((B), p = 0.055; (D), p = 0.035) after adjusting for Hoehn and Yahr stage ((B), p = 0.011; (D), p = 0.012). p-values were adjusted using the post hoc Tukey–Kramer method for multiple comparisons. No differences were observed for all other outcomes. Values are untransformed least squares means ± SEM. Abbreviations: MediDiet, Mediterranean diet.

References

    1. Lees A.J., Hardy J., Revesz T. Parkinson’s disease. Lancet. 2009;373:2055–2066. doi: 10.1016/S0140-6736(09)60492-X. - DOI - PubMed
    1. Bloem B.R., Okun M.S., Klein C. Parkinson’s disease. Lancet. 2021;397:2284–2303. doi: 10.1016/S0140-6736(21)00218-X. - DOI - PubMed
    1. Mulak A., Bonaz B. Brain-gut-microbiota axis in Parkinson’s disease. World J. Gastroenterol. 2015;21:10609–10620. doi: 10.3748/wjg.v21.i37.10609. - DOI - PMC - PubMed
    1. Chandra R., Sokratian A., Chavez K.R., King S., Swain S.M., Snyder J.C., West A.B., Liddle R.A. Gut mucosal cells transfer alpha-synuclein to the vagus nerve. JCI Insight. 2023;8:e172192. doi: 10.1172/jci.insight.172192. - DOI - PMC - PubMed
    1. Sampson T.R., Debelius J.W., Thron T., Janssen S., Shastri G.G., Ilhan Z.E., Challis C., Schretter C.E., Rocha S., Gradinaru V., et al. Gut microbiota regulate motor deficits and neuroinflammation in a model of Parkinson’s disease. Cell. 2016;167:1469–1480.e12. doi: 10.1016/j.cell.2016.11.018. - DOI - PMC - PubMed

Publication types

LinkOut - more resources