

Ultrasonic Assessment of Liver Fibrosis Using One-Dimensional Convolutional Neural Networks Based on Frequency Spectra of Radiofrequency Signals with Deep Learning Segmentation of Liver Regions in B-Mode Images: A Feasibility Study
- PMID: 39275424
- PMCID: PMC11397918
- DOI: 10.3390/s24175513
Ultrasonic Assessment of Liver Fibrosis Using One-Dimensional Convolutional Neural Networks Based on Frequency Spectra of Radiofrequency Signals with Deep Learning Segmentation of Liver Regions in B-Mode Images: A Feasibility Study
Abstract
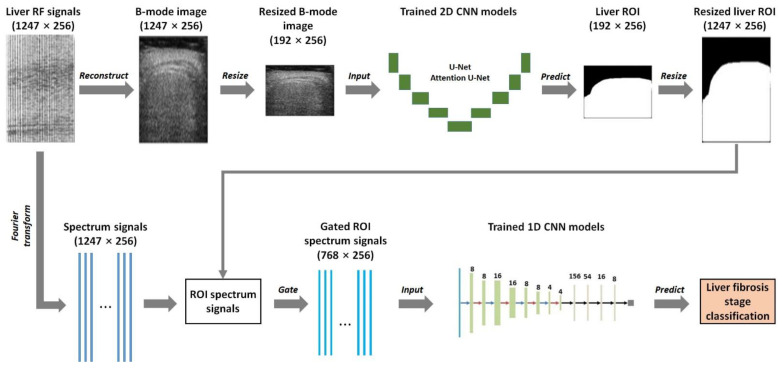
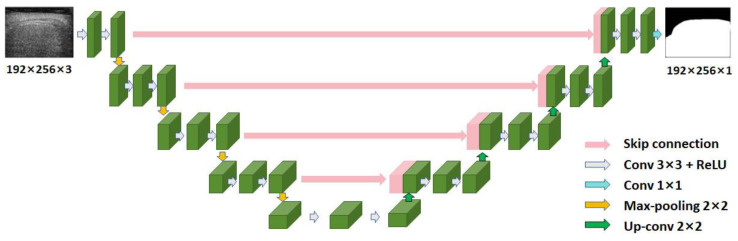
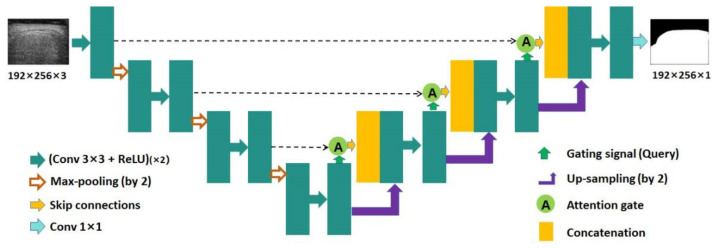
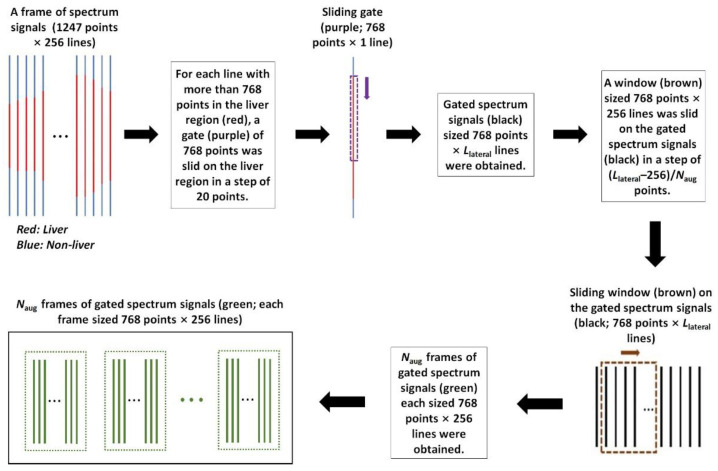
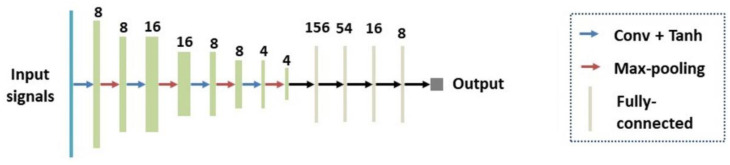
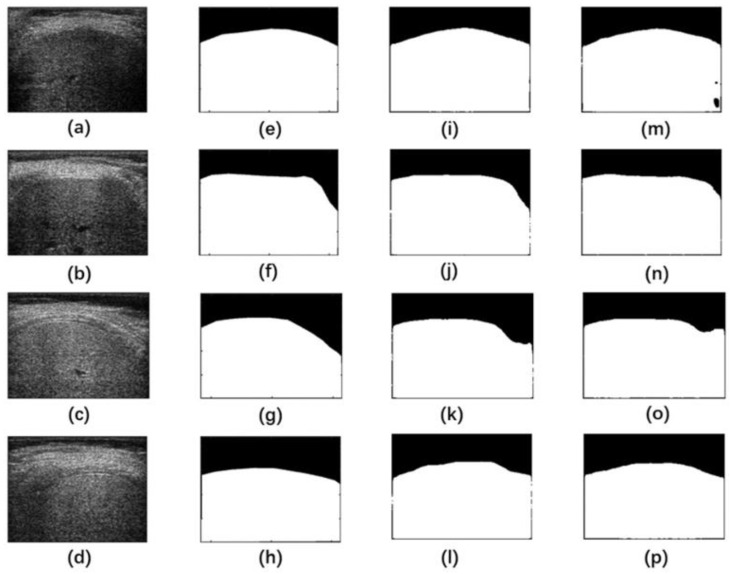
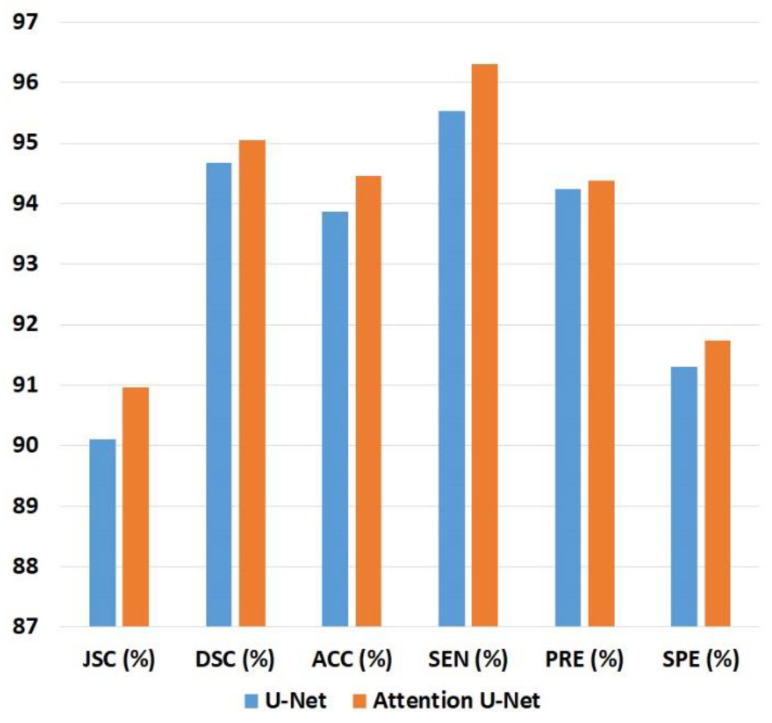
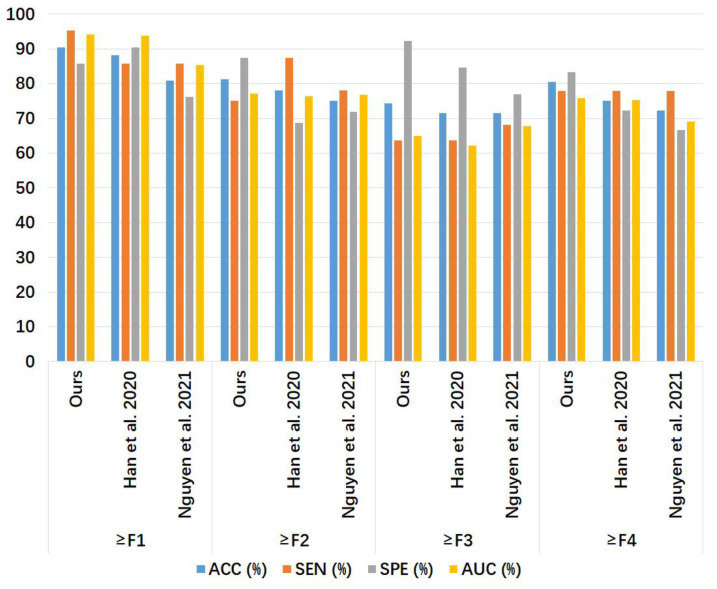
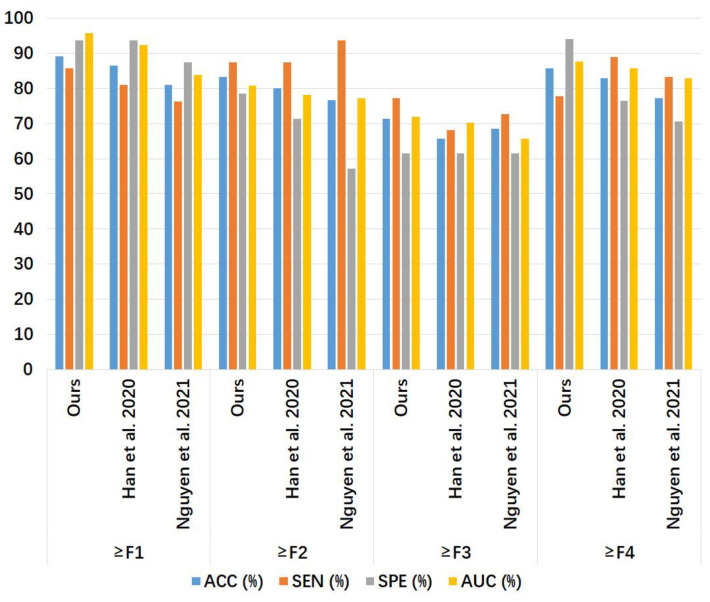
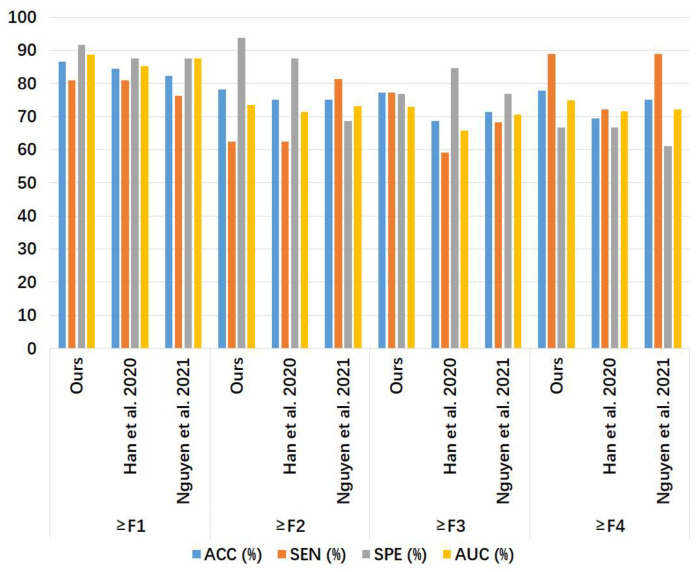
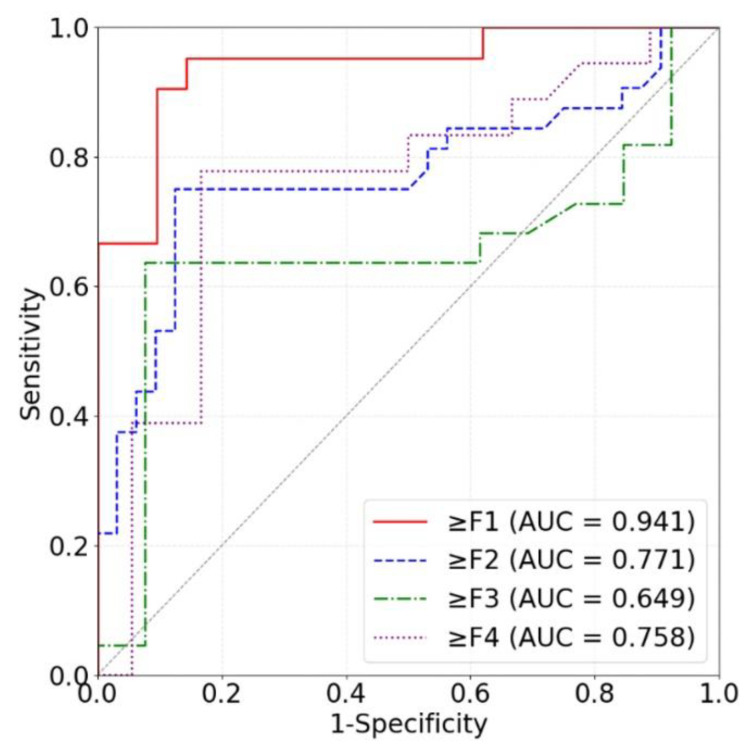
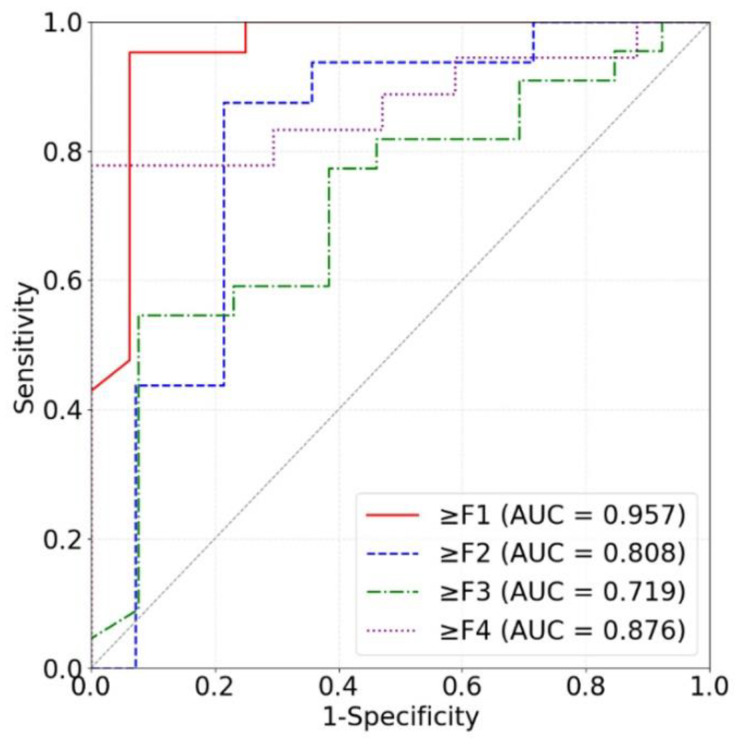
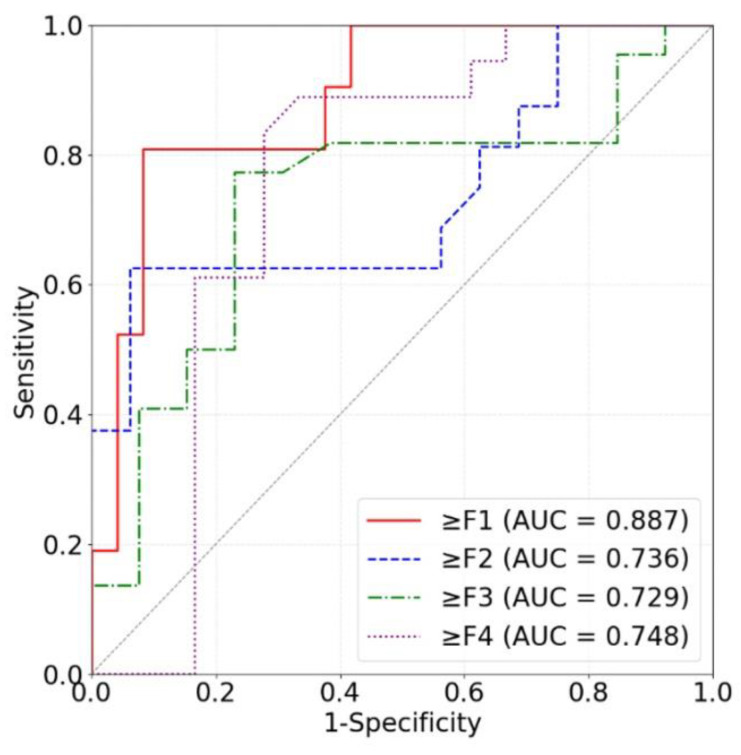
The early detection of liver fibrosis is of significant importance. Deep learning analysis of ultrasound backscattered radiofrequency (RF) signals is emerging for tissue characterization as the RF signals carry abundant information related to tissue microstructures. However, the existing methods only used the time-domain information of the RF signals for liver fibrosis assessment, and the liver region of interest (ROI) is outlined manually. In this study, we proposed an approach for liver fibrosis assessment using deep learning models on ultrasound RF signals. The proposed method consisted of two-dimensional (2D) convolutional neural networks (CNNs) for automatic liver ROI segmentation from reconstructed B-mode ultrasound images and one-dimensional (1D) CNNs for liver fibrosis stage classification based on the frequency spectra (amplitude, phase, and power) of the segmented ROI signals. The Fourier transform was used to obtain the three kinds of frequency spectra. Two classical 2D CNNs were employed for liver ROI segmentation: U-Net and Attention U-Net. ROI spectrum signals were normalized and augmented using a sliding window technique. Ultrasound RF signals collected (with a 3-MHz transducer) from 613 participants (Group A) were included for liver ROI segmentation and those from 237 participants (Group B) for liver fibrosis stage classification, with a liver biopsy as the reference standard (Fibrosis stage: F0 = 27, F1 = 49, F2 = 51, F3 = 49, F4 = 61). In the test set of Group A, U-Net and Attention U-Net yielded Dice similarity coefficients of 95.05% and 94.68%, respectively. In the test set of Group B, the 1D CNN performed the best when using ROI phase spectrum signals to evaluate liver fibrosis stages ≥F1 (area under the receive operating characteristic curve, AUC: 0.957; accuracy: 89.19%; sensitivity: 85.17%; specificity: 93.75%), ≥F2 (AUC: 0.808; accuracy: 83.34%; sensitivity: 87.50%; specificity: 78.57%), and ≥F4 (AUC: 0.876; accuracy: 85.71%; sensitivity: 77.78%; specificity: 94.12%), and when using the power spectrum signals to evaluate ≥F3 (AUC: 0.729; accuracy: 77.14%; sensitivity: 77.27%; specificity: 76.92%). The experimental results demonstrated the feasibility of both the 2D and 1D CNNs in liver parenchyma detection and liver fibrosis characterization. The proposed methods have provided a new strategy for liver fibrosis assessment based on ultrasound RF signals, especially for early fibrosis detection. The findings of this study shed light on deep learning analysis of ultrasound RF signals in the frequency domain with automatic ROI segmentation.
Keywords: convolutional neural network; deep learning; liver fibrosis; liver region segmentation; ultrasound radiofrequency signal.
Conflict of interest statement
The authors declare no conflicts of interest. The funders had no role in the design of the study, in the collection, analyses, or interpretation of data, in the writing of the manuscript, or in the decision to publish the results.
Figures
Similar articles
-
Evaluation of Hepatic Fibrosis Using Ultrasound Backscattered Radiofrequency Signals and One-Dimensional Convolutional Neural Networks.Diagnostics (Basel). 2022 Nov 17;12(11):2833. doi: 10.3390/diagnostics12112833. Diagnostics (Basel). 2022. PMID: 36428892 Free PMC article.
-
Temporal stability assessment in shear wave elasticity images validated by deep learning neural network for chronic liver disease fibrosis stage assessment.Med Phys. 2019 May;46(5):2298-2309. doi: 10.1002/mp.13521. Epub 2019 Apr 15. Med Phys. 2019. PMID: 30929260
-
RFImageNet framework for segmentation of ultrasound images with spectra-augmented radiofrequency signals.Ultrasonics. 2025 Feb;146:107498. doi: 10.1016/j.ultras.2024.107498. Epub 2024 Oct 28. Ultrasonics. 2025. PMID: 39486316
-
Automatic Segmentation of Multiple Organs on 3D CT Images by Using Deep Learning Approaches.Adv Exp Med Biol. 2020;1213:135-147. doi: 10.1007/978-3-030-33128-3_9. Adv Exp Med Biol. 2020. PMID: 32030668 Review.
-
Medical Image Segmentation: A Comprehensive Review of Deep Learning-Based Methods.Tomography. 2025 Apr 30;11(5):52. doi: 10.3390/tomography11050052. Tomography. 2025. PMID: 40423254 Free PMC article. Review.
Cited by
-
Advancements in Artificial Intelligence-Enhanced Imaging Diagnostics for the Management of Liver Disease-Applications and Challenges in Personalized Care.Bioengineering (Basel). 2024 Dec 9;11(12):1243. doi: 10.3390/bioengineering11121243. Bioengineering (Basel). 2024. PMID: 39768061 Free PMC article. Review.
-
Revolutionizing Molecular Design for Innovative Therapeutic Applications through Artificial Intelligence.Molecules. 2024 Sep 29;29(19):4626. doi: 10.3390/molecules29194626. Molecules. 2024. PMID: 39407556 Free PMC article. Review.
References
-
- Taylor R.S., Taylor R.J., Bayliss S., Hagström H., Nasr P., Schattenberg J.M., Ishigami M., Toyoda H., Wai-Sun Wong V., Peleg N., et al. Association between fibrosis stage and outcomes of patients with nonalcoholic fatty liver disease: A systematic review and meta-analysis. Gastroenterology. 2020;158:1611–1625. doi: 10.1053/j.gastro.2020.01.043. - DOI - PubMed
-
- Seeff L.B., Everson G.T., Morgan T.R., Curto T.M., Lee W.M., Ghany M.G., Shiffman M.L., Fontana R.J., Di Bisceglie A.M., Bonkovsky H.L., et al. Complication rate of percutaneous liver biopsies among persons with advanced chronic liver disease in the HALT-C trial. Clin. Gastroenterol Hepatol. 2010;8:877–883. doi: 10.1016/j.cgh.2010.03.025. - DOI - PMC - PubMed
-
- Oelze M.L., Mamou J. Quantitative Ultrasound in Soft Tissues. 2nd ed. Springer; Cham, Germany: 2023. pp. 1–301.
-
- Zhou Z., Gao R., Wu S., Ding Q., Bin G., Tsui P.H. Scatterer size estimation for ultrasound tissue characterization: A survey. Measurement. 2024;225:114046. doi: 10.1016/j.measurement.2023.114046. - DOI
MeSH terms
Grants and funding
LinkOut - more resources
Full Text Sources
Medical
Miscellaneous
