Observational Study
. 2024 Aug 30;24(17):5637.
doi: 10.3390/s24175637.

Wearable Sensor-Based Assessments for Remotely Screening Early-Stage Parkinson's Disease

Affiliations
Observational Study

Wearable Sensor-Based Assessments for Remotely Screening Early-Stage Parkinson's Disease

Shane Johnson et al. Sensors (Basel). .

Abstract

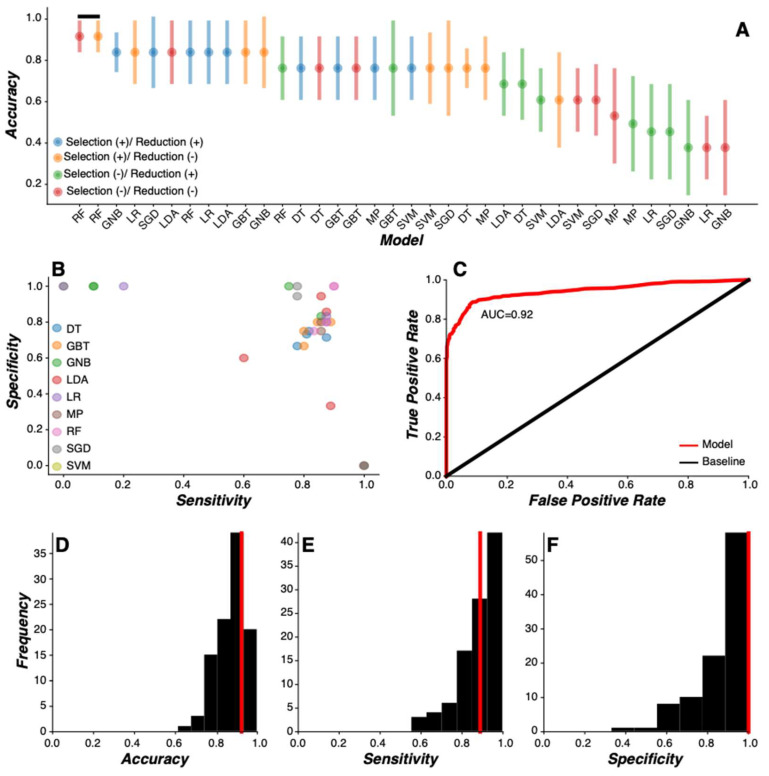
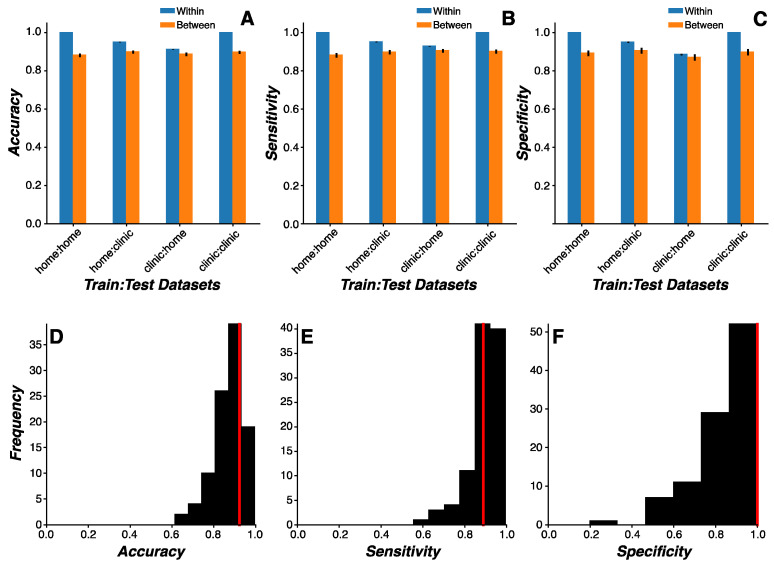
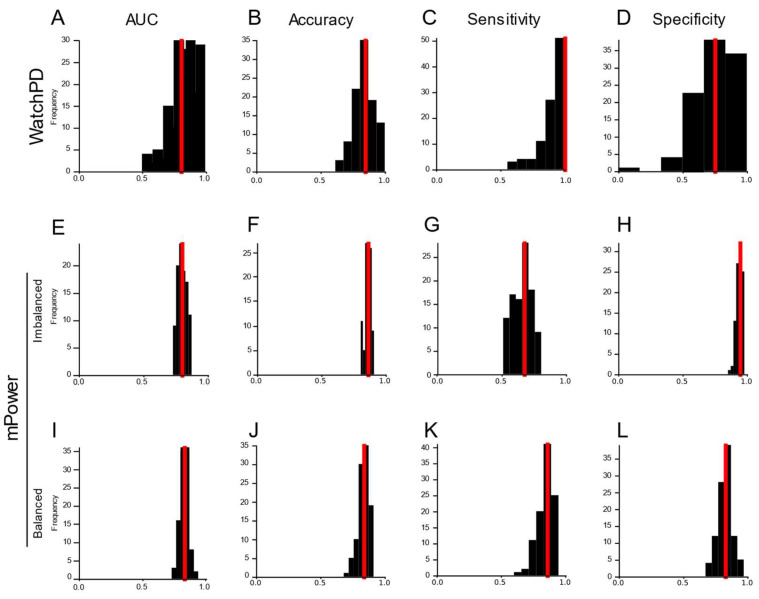
Prevalence estimates of Parkinson's disease (PD)-the fastest-growing neurodegenerative disease-are generally underestimated due to issues surrounding diagnostic accuracy, symptomatic undiagnosed cases, suboptimal prodromal monitoring, and limited screening access. Remotely monitored wearable devices and sensors provide precise, objective, and frequent measures of motor and non-motor symptoms. Here, we used consumer-grade wearable device and sensor data from the WATCH-PD study to develop a PD screening tool aimed at eliminating the gap between patient symptoms and diagnosis. Early-stage PD patients (n = 82) and age-matched comparison participants (n = 50) completed a multidomain assessment battery during a one-year longitudinal multicenter study. Using disease- and behavior-relevant feature engineering and multivariate machine learning modeling of early-stage PD status, we developed a highly accurate (92.3%), sensitive (90.0%), and specific (100%) random forest classification model (AUC = 0.92) that performed well across environmental and platform contexts. These findings provide robust support for further exploration of consumer-grade wearable devices and sensors for global population-wide PD screening and surveillance.

Keywords: Parkinson’s disease; digital biomarkers; early detection; feature engineering; gait analysis; mobile health technologies; phonation; remote monitoring; wearable sensors.


Conflict of interest statement

D. Anderson, J. Severson., A. Best, M. Merickel., D. Amato, B. Severson, S. Jezewski, S. Polyak, A. Keil, M. Kantartjis, and S. Johnson are employees of Clinical ink, who acquired the BrainBaseline Movement Disorders platform in 2021. E.R. Dorsey has received compensation for consulting services from Abbott, Abbvie, Acadia, Acorda, Bial-Biotech Investments, Inc., Biogen, Boehringer Ingelheim, California Pacific Medical Center, Caraway Therapeutics, Curasen Therapeutics, Denali Therapeutics, Eli Lilly, Genentech/Roche, Grand Rounds, Huntington Study Group, Informa Pharma Consulting, Karger Publications, LifeSciences Consultants, MCM Education, Mediflix, Medopad, Medrhythms, Merck, Michael J. Fox Foundation, NACCME, Neurocrine, NeuroDerm, NIH, Novartis, Origent Data Sciences, Otsuka, Physician’s Education Resource, Praxis, PRIME Education, Roach, Brown, McCarthy & Gruber, Sanofi, Seminal Healthcare, Spark, Springer Healthcare, Sunovion Pharma, Theravance, Voyager and WebMD; research support from Biosensics, Burroughs Wellcome Fund, CuraSen, Greater Rochester Health Foundation, Huntington Study Group, Michael J. Fox Foundation, National Institutes of Health, Patient-Centered Outcomes Research Institute, Pfizer, PhotoPharmics, Safra Foundation, and Wave Life Sciences; editorial services for Karger Publications; stock in Included Health and in Mediflix, and ownership interests in SemCap. J.L. Adams has received compensation for consulting services from VisualDx and the Huntington Study Group; and research support from Biogen, Biosensics, Huntington Study Group, Michael J. Fox Foundation, National Institutes of Health/National Institute of Neurological Disorders and Stroke, NeuroNext Network, and Safra Foundation. M.A. Kostrzebski holds stock in Apple, Inc. T. Kangarloo is an employee of and owns stock in Takeda Pharmaceuticals, Inc. J. Cosman Cosman is an employee of and owns stock in AbbVie Pharmaceuticals.

Figures

Figure 1
Figure 1
Evaluating feature selectivity. Linear regression was performed on each feature independently to evaluate feature selectivity for early-stage PD status. F-statistics from feature-wise linear regression were aggregated into a distribution and the threshold for significance was set to p < 0.05 (red line). In fact, 38.6% of all features were significantly associated with early-stage PD status. Variability in feature selectivity was observed across assessments (Table 3).
Figure 2
Figure 2
Machine learning model comparison. (A) Accuracy (median ± IQR) of machine learning model as a function of each model evaluated. Each modeling routine was preceded with (+) or without (−) feature selection and feature reduction routines (see legend). Model classification accuracy was sorted by value and all models with statistically similar classification accuracy values (Wilcoxon signed-rank test) were identified as the optimal models (black line). The random forest model without feature selection or feature reduction routines (red) was the most accurate and parsimonious model. (B) The sensitivity and specificity of each model were plotted as a function of each other. Four values are present for each model, representing the inclusion or exclusion of feature selection and feature reduction routines. (C) The receiver-operator curve (ROC) for the random forest model without feature selection or feature reduction routines across all Monte Carlo simulations (n = 100) showed an area under the curve (AUC) of 0.92 (IQR: 0.85–0.95) in detecting PD status. (DF) Distribution of model classification accuracy (D), sensitivity (E), and specificity (F) for the random forest model without feature selection or feature reduction routines across all Monte Carlo simulations (n = 100). Median values for each model performance metric (red line) are denoted. (DT = decision tree; GBT = gradient boosted tree; GNB = Gaussian naïve Bayes; LDA = linear discriminant analysis; LR = logistic regression; MP = multilayer perceptron; RF = random forest; SGD = stochastic gradient descent; SVM = support vector machine).
Figure 3
Figure 3
Random forest model feature importance. (A) Feature importance values (x-axis) for the features with the highest importance (n = 50; y-axis). Feature importance was calculated as the accumulation of the impurity decrease within each tree in the random forest model. The most important features were derived from the Finger Tapping (red), Gait and Balance (blue), and Tremor (magenta) tasks. (B) Cumulative probability distribution of the proportion of features represented within each assessment as a function of features ordered by importance. Features engineered from SDMT, Finger Tapping, Trails, Fine Motor, and Tremor were proportionally ranked higher in feature importance relative to chance (dotted black line). (C) Cumulative probability distribution of the proportion of features generated from the watch, phone, and watch–phone synchronization from the Gait and Balance task as a function of features ordered by importance. Features engineered from the watch were ranked proportionally higher in feature importance relative to features engineered from the phone and watch–phone synchronization.
Figure 4
Figure 4
Cross-environmental learning. (AC) Mean model classification accuracy (A), sensitivity (B), and specificity (C) for random forest model predictions as a function of training and test environmental contexts (home or clinic) (error bars represent the standard error of the mean). Model predictions were generated for either the same subjects (within; blue bars) or independent subjects (between; orange bars). Classification accuracy was higher when predictions were made on the same relative to independent subjects (p < 0.0001) and when models were trained on home data relative to clinic data (p = 0.0007). When model predictions were made on data generated by independent subjects, no difference in classification accuracy was observed across environmental contexts (p > 0.14). (DF) Distribution of model classification accuracy (D), sensitivity (E), and specificity (F) for the random forest model trained on clinic data and tested on home data in independent subjects across all Monte Carlo simulations (n = 100). Median values for each model performance metric (red line) are denoted.
Figure 5
Figure 5
Evaluating the mPower dataset. Distribution of AUC (A,E,I), accuracy (B,F,J), sensitivity (C,G,K), and specificity (D,H,L) for model classification results across all Monte Carlo simulations (n = 100) for the reduced feature sets common to both the mPower and WATCH-PD study datasets. In the WATCH-PD reduced feature set (AD), a random forest model without feature selection or feature reduction was the best-performing model. In both the imbalanced (EH) and balanced (IL) mPower feature sets, a gradient boosted tree model without feature selection or feature reduction was the best-performing model. Median values for each model performance metric (red line) are denoted.
Figure 6
Figure 6
Feature reliability. (A,B) The external reliability of each feature was evaluated using intraclass correlations (ICC) between the clinic and home measurements. The proportion of features higher than the threshold for moderate ICC values (ICC = 0.6) (A) and mean ICC values (error bars represent the standard error of the mean) across all features (B) were evaluated for each assessment. (C,D) The test-retest reliability of each feature was evaluated using ICC between measurements across all time bins. The proportion of features higher than the threshold for moderate ICC values (ICC = 0.6) (C) and mean ICC values (error bars represent the standard error of the mean) across all features (D) were evaluated for each assessment. (E,F) Distribution of the ICC coefficients, only for features with the highest feature importance values (Figure 3A). ICC coefficients were significantly higher than the threshold (ICC = 0.6; red line) for both external reliability (p < 0.00001; (E)) and test-retest reliability (p < 0.00001; (F)) analyses.

References

    1. Dorsey E.R., Bloem B.R. The Parkinson Pandemic—A Call to Action. JAMA Neurol. 2018;75:9. doi: 10.1001/jamaneurol.2017.3299. - DOI - PubMed
    1. Marras C., Beck J.C., Bower J.H., Roberts E., Ritz B., Ross G.W., Abbott R.D., Savica R., Van Den Eeden S.K., Willis A.W., et al. Prevalence of Parkinson’s Disease across North America. NPJ Park. Dis. 2018;4:21. doi: 10.1038/s41531-018-0058-0. - DOI - PMC - PubMed
    1. Rossi A., Berger K., Chen H., Leslie D., Mailman R.B., Huang X. Projection of the Prevalence of Parkinson’s Dis-ease in the Coming Decades: Revisited. Mov. Disord. 2018;33:156. doi: 10.1002/mds.27063. - DOI - PMC - PubMed
    1. Achey M., Aldred J.L., Aljehani N., Bloem B.R., Biglan K.M., Chan P., Cubo E., Ray Dorsey E., Goetz C.G., Guttman M., et al. The Past, Present, and Future of Telemedicine for Parkinson’s Disease. Mov. Disord. 2014;29:871. doi: 10.1002/mds.25903. - DOI - PubMed
    1. Postuma R.B., Berg D., Stern M., Poewe W., Olanow C.W., Oertel W., Obeso J., Marek K., Litvan I., Lang A.E., et al. MDS Clinical Diagnostic Criteria for Parkinson’s Disease. Mov. Disord. 2015;30:1591–1601. doi: 10.1002/mds.26424. - DOI - PubMed

Publication types

LinkOut - more resources