

Sequential Injection Analysis Method for the Determination of Glutathione in Pharmaceuticals
- PMID: 39275587
- PMCID: PMC11397749
- DOI: 10.3390/s24175677
Sequential Injection Analysis Method for the Determination of Glutathione in Pharmaceuticals
Abstract
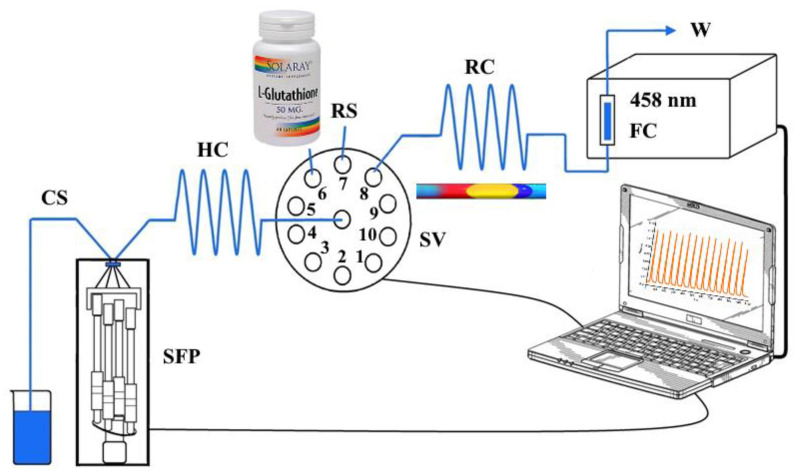
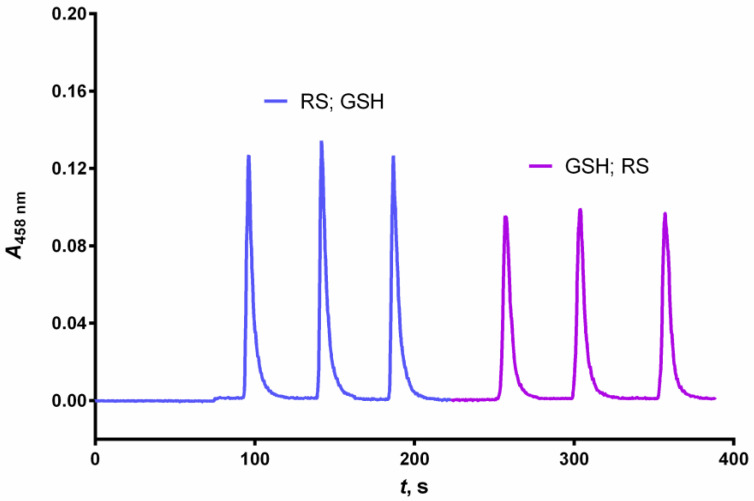
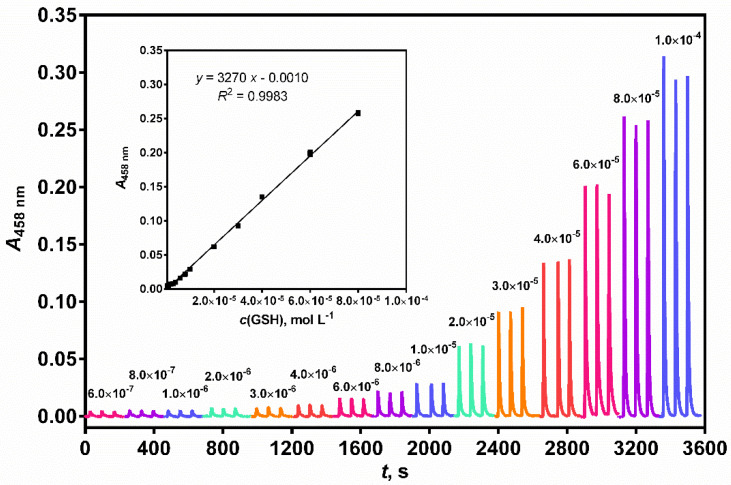
A sequential injection analysis method for the determination of glutathione (GSH) in pharmaceuticals has been developed. It is based on the reduction of the Cu(II)-neocuproine complex by GSH and the formation of an orange-yellow colored Cu(I)-neocuproine complex with maximum absorbance at 458 nm. Under optimal conditions the method is characterized by a linear calibration range of 6.0 × 10⁻⁷-8.0 × 10⁻⁵ mol L-1 (Amax = 3270 CGSH - 0.0010; R2 = 0.9983), limit of detection of 2.0 × 10⁻⁷ mol L-1, limit of quantification of 6.7 × 10⁻⁷ mol L-1, repeatability (expressed as relative standard deviation) of 3.8%, and sampling rate of 60 h-1. The newly developed method has been successfully applied to the determination of GSH in pharmaceutical samples with no statistically significant difference between the results obtained and those produced by the standard Pharmacopoeia method.
Keywords: glutathione; neocuproine; pharmaceuticals; sequential injection analysis.
Conflict of interest statement
The authors report there are no competing interests to declare.
Figures


Similar articles
-
Flow-injection determination of cysteine in pharmaceuticals based on luminol-persulphate chemiluminescence detection.Luminescence. 2008 May-Jun;23(3):144-9. doi: 10.1002/bio.1024. Luminescence. 2008. PMID: 18452132
-
Sensitive determination of 2-methoxyestradiol in pharmaceutical preparations and serum samples using flow injection chemiluminescence.Luminescence. 2014 May;29(3):261-5. doi: 10.1002/bio.2538. Epub 2013 Jul 8. Luminescence. 2014. PMID: 23836511
-
Photometric Determination of Iron in Pharmaceutical Formulations Using Double-Beam Direct Injection Flow Detector.Molecules. 2021 Jul 26;26(15):4498. doi: 10.3390/molecules26154498. Molecules. 2021. PMID: 34361650 Free PMC article.
-
Flow injection spectrophotometric determination of ofloxacin in pharmaceuticals and urine.Eur J Pharm Biopharm. 2005 Sep;61(1-2):87-93. doi: 10.1016/j.ejpb.2005.03.007. Eur J Pharm Biopharm. 2005. PMID: 16005199
-
An overview of qualimetric strategies for optimisation and calibration in pharmaceutical analysis using flow injection techniques.Anal Bioanal Chem. 2003 Nov;377(5):863-74. doi: 10.1007/s00216-003-2142-4. Epub 2003 Aug 28. Anal Bioanal Chem. 2003. PMID: 14564437 Review.
References
-
- Berg J.M., Tymoczko J.L., Stryer L. Biochemistry. 5th ed. W.H. Freeman Publishing; New York, NY, USA: 2002. pp. 1018–1029.
MeSH terms
Substances
Grants and funding
LinkOut - more resources
Full Text Sources
