. 2024 Sep 5;24(17):5788.
doi: 10.3390/s24175788.

Twenty-Meter Laser Strainmeter "Popova Isl."

Affiliations

Twenty-Meter Laser Strainmeter "Popova Isl."

Mikhail Bolsunovskii et al. Sensors (Basel). .

Abstract

This paper describes the design and principle of operation of a 20 m laser strainmeter of unequal-arm type created on the basis of a Michelson interferometer and frequency-stabilized helium-neon laser. The interferometry methods used allow the measurement of the displacement of an Earth's crust section on the base of the laser strainmeter with an accuracy of 30 pm in the frequency range from 0 (conventionally) to 1000 Hz. This laser strainmeter, when connected to an accurate time system providing an accuracy of 1 μs, should structurally become a part of the laser interferometric seismoacoustic observatory, consisting of spatially separated laser strainmeters installed in various regions of Russia.

Keywords: Michelson interferometer; laser strainmeter.


Conflict of interest statement

The authors declare no conflicts of interest.

Figures

Figure 1
Figure 1
Structure diagram of a long base laser strainmeter of unequal-arm type.
Figure 2
Figure 2
Optical scheme of Michelson interferometer: S—light source, BS—dividing plate, M1 and M2—flat mirrors, ΔzM—difference of the interferometer arm lengths.
Figure 3
Figure 3
Block diagram of the single-axis-type laser strainmeter “Popova Isl.”, unequal-arm version. 1, 6—granite (concrete) blocks, 2—central interference unit, 3, 7—underground hydrothermally insulated laboratory rooms, 4—optical light guide, 5—corner reflector.
Figure 4
Figure 4
Amplitude–frequency response of a classical-type single-axis laser strainmeter with measuring arm length of 20 m in the infrasound region (0–1 Hz).
Figure 5
Figure 5
Amplitude–frequency response of a classical-type single-axis laser strainmeter with measuring arm length of 20 m in the infrasound region (50–300 Hz).
Figure 6
Figure 6
Graphical representation of the modulation method.
Figure 7
Figure 7
Functional diagram of the laser strainmeter registration system. PA—perturbation influence, OS—optical system, PHA + BPF—photocurrent amplifier and bandpass (or resonant) filter, D—detector, D/A C—digital-to-analog converter, A—amplifier, OUT—output signal.
Figure 8
Figure 8
The procedure of restoring the output signal from its pieces. UHBC—unrestored voltage, UBC—restored voltage. The arrows indicate the direction of the offset of the UHBC graph.
Figure 9
Figure 9
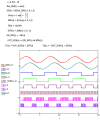
Block diagram of the controller and timing diagram demonstrating the operation of its constituent units. MCU1, MCU2—microcontrollers; LOG—logical block; DAC1—resistive two-stage 8-bit DAC; DAC2—executive DAC, 12–14 bits; Ug—search sinusoidal signal; GD and BFD—amplified and limited search and output signal of the object; STR—measuring strobe; PP and NP—signal pulses.
Figure 10
Figure 10
Controller–detector logic unit. GD and BFD—amplified and limited search and output signal of the object; STR—measuring strobe; PP and NP—signal pulses; CTL—signal diagnostic subsystem of the controller; Ug— search signal of the system; Us—shifted.
Figure 11
Figure 11
Implementation of the given controller–detector signals in the Mathcad system.
Figure 12
Figure 12
Visualization of the output signal of the phase detector when two signals with similar frequencies are supplied. Red—PP signal; Blue—NP signal; Green—output signal.
Figure 13
Figure 13
Static characteristics of the phase detector. N—difference of counted pulses T1 and T2, N90—number of pulses counted at phase shift equal to 90°.
Figure 14
Figure 14
One of the implementations of the controller–detector (Laboratory of Physics of Geospheres). 1—MCU1 based on the STM32F0 Discovery board, 2—bipolar digital-to-analog converter based on DAC8806, 3—MCU2 ATmega16.
Figure 15
Figure 15
Spectra obtained from processing the laser strainmeter record at the moment of operation of the hydroacoustic emitter at the frequency of 22 Hz.
Figure 16
Figure 16
Registration of the Kamchatka earthquake on 17 August 2024 by the twenty-meter laser strainmeter (UTC time).

References

    1. Vali V., Krogstad R., Moss R. Interferometer with OKG for measuring deformations of the Earth’s surface. PIEREE. 1965;9:186–194.
    1. Vali V., Krogstad R. Laser interferometer with a base of 1000 m. Rev. Sci. Instrum. 1968;39:52–61.
    1. Berger L. Laser measurement of crustal deformations. Rev. Sci. Instrum. 1969;40:41–48.
    1. Volnov M.I., Garnov V.V., Gubin M.A., Nikitin V.V., Petruhin L.I. Laser geophysical seismograph. Preprint. 1979;144:29.
    1. Takemoto S., Araya A., Akamatsu J., Morii W., Momose H., Ohashi M., Kawasaki I., Higashi T., Fukuda Y., Miyoki S. A 100 m laser strainmeter system installed in a 1 km deep tunnel at Kamioka, Gifu, Japan. J. Geodyn. 2006;38:477–488. doi: 10.1016/j.jog.2004.07.008. - DOI

LinkOut - more resources