. 2024 Oct 1;40(39):20559-20575.
doi: 10.1021/acs.langmuir.4c02311. Epub 2024 Sep 14.

Wetting Preference of Silica Surfaces in the Context of Underground Hydrogen Storage: A Molecular Dynamics Perspective

Affiliations

Wetting Preference of Silica Surfaces in the Context of Underground Hydrogen Storage: A Molecular Dynamics Perspective

Mohamad Ali Ghafari et al. Langmuir. .

Abstract

The growing interest in large-scale underground hydrogen (H2) storage (UHS) emphasizes the need for a comprehensive understanding of the fundamental characteristics of subsurface environments. The wetting preference of subsurface rock is a crucial parameter influencing the H2 flow behavior during storage and withdrawal processes. In this study, we utilized molecular dynamics simulation to evaluate the wetting preference of the silica surface in subsurface hydrogen systems, with the aim of addressing disparities observed in experimental results. We conducted an initial comprehensive assessment of potential models, comparing the wettability of five common silica surfaces with different surface morphologies and hydroxyl densities in CO2-H2/water/silica systems against experimental data. After introducing the INTERFACE force field as the most accurate potential model for the silica surface, we evaluated the wetting behavior of the α-quartz (101) surface with a hydroxyl density of 5.9 number/nm2 under the impact of actual geological storage conditions (333-413 K and 10-30 MPa), the coexistence of cushion gases (i.e., CO2, CH4, and N2) at various mole fractions, and pH levels ranging from 2 to 11 characterized through considering the negative charges of 0 to -0.12 C/m2 via deprotonation of silanol on the silica surface. Our results indicate that neither pressure nor temperature has a significant impact on the wetness of the silica in the case of pure H2 (single component UHS operations). However, when CO2 coexists with H2, especially at higher mole fractions, an increase in pressure and a decrease in temperature lead to higher contact angles. Moreover, when the mole fraction of cushion gas ranges from 0 to 1, the contact angle increases 20, 9.5, and 4.5° for CO2, CH4, and N2, respectively, on the neutral silica substrate. Interestingly, at higher pH conditions where the silica surface carries a negative charge, the contact angle considerably reduces where surface charges of -0.03 and -0.06 C/m2 result in an average reduction of 20 and 80% in the contact angle, respectively. More importantly, at a pH of ∼11 (-0.12 C/m2), a 0° contact angle is observed for the silica surface under all temperatures, pressures, types of cushion gases, and varying mole fractions.


Conflict of interest statement

The authors declare no competing financial interest.

Figures

Figure 1
Figure 1
Top-view representations illustrating the structures of five distinct types of silica surfaces during evaluating the accuracy assessment of force fields stage: (a) Q3/Q4 (2.35), (b) Q3 (4.35), (c) Q3 (4.7), (d) Q3 (5.9), and (e) Q2 (9.58).
Figure 2
Figure 2
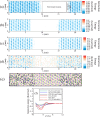
Top view of α–quartz (101) surfaces exhibiting the negative surface charge of (a) −0.03, (b) −0.06, and (c) −0.12 C/m2, along with the (d) initial configuration of the simulation system containing a slab with a surface charge of −0.12 C/m2 and the inclusion of CO2 cushion gas alongside H2 with a mole fraction of 0.7:0.3 for H2/CO2 under thermodynamic conditions of 20 MPa pressure and a temperature of 373 K. The deprotonated oxygens are visually represented by the color purple.
Figure 3
Figure 3
Contact angle values resulting from three force fields in the following systems: (a) water/silica at 300 and 323 K, (b) H2/water/silica, and (c) CO2/water/silica, at P = 10 MPa and T = 323 K. The obtained results are compared with MD simulations [Bistafa et al., Yang et ala., Yang et alb. (P = 40 MPa and T = 298 K), Zheng et al. (T = 338 K), Chen et al. (P = 10.5 MPa and T = 318 K), Yu et al. (P = 10.1 MPa), and Yang et al.c (P = 20 MPa)] and experimental data [Kowalczyk et al., Esfandyari et al. (T = 313 K), Hashemi et al., Sutjiadi-Sia et al. (T = 313 K), and Alnili et al..
Figure 4
Figure 4
Contact angle values within a specific temperature and pressure range of 333–413 K and 10–30 MPa, respectively, for the neutral Q3 (5.9) in the H2 + CO2/water/silica system with a H2/CO2 mole fraction equal to (a) 1.0:0.0, (b) 0.7:0.3, and (c) 0.3:0.7.
Figure 5
Figure 5
Contact angle values in systems with distinct negative surface charges under temperature and pressure conditions of 373 K and 20 MPa, alongside various compositions of cushion gas, namely (a) N2, (b) CH4, and (c) CO2. *The water droplet’s contact angle on the surface, with the surface charge of −0.12 C/m2, remains consistently 0° across the wide range of pressure (10–30 MPa) and temperature (333–413 K). These findings hold true for three different cushion gases and varying mole fractions.
Figure 6
Figure 6
Adsorption amount and surface excess within a specific temperature and pressure range of 333–413 K and 10–30 MPa for various gas mixtures, with H2/cushion gas mole fractions of (a,d) 1.0:0.0 and 0.0:1.0, (b,e) 0.7:0.3, and (c,f) 0.3:0.7.
Figure 7
Figure 7
Adsorption amount and surface excess separately for each gas within a specific temperature and pressure range of 333–413 K and 10–30 MPa for various gas mixtures, with H2/cushion gas mole fractions of (a,c) 0.7:0.3 and (b,d) 0.3:0.7.
Figure 8
Figure 8
Two-dimensional (xy) interaction energy between the gas and the surface in the system comprising pure gases, namely (a) H2, (b) N2, (c) CH4, and (d) CO2. (e) Top view of the final configuration of the adsorption layer within the simulation system consisting of pure CH4 (CH4 molecules are depicted in gray, while internal and external silanol hydrogen atoms are displayed in blue and green, respectively). (f) Interaction property profile (along the z-axis) between the surface and four gases within simulation systems comprising pure gas.
Figure 9
Figure 9
Two-dimensional (xz) gas density in systems comprising pure gases, namely (a) H2, (b) N2, (c) CH4, and (d) CO2.
Figure 10
Figure 10
(a) Radial distribution function, g(r), between deprotonated oxygen (Od) and water hydrogen atoms (Hw), as well as water oxygen atoms (Ow), (b) distribution of the average dipole vector of water molecules, in terms of vertical distance from the surface, across four surfaces exhibiting different surface charges, (c) two-dimensional (xy) density representation of water hydrogen atoms within the water adsorption layer, and (d) two-dimensional (xy) interaction energy between water molecules and the surface. All components (a,c,d) are presented for the surface with the surface charge of −0.12 C/m2 in the H2/water/silica system.

References

    1. Seo S.-K.; Yun D.-Y.; Lee C.-J. Design and optimization of a hydrogen supply chain using a centralized storage model. Appl. Energy 2020, 262, 114452.10.1016/j.apenergy.2019.114452. - DOI
    1. Gabrielli P.; Poluzzi A.; Kramer G. J.; Spiers C.; Mazzotti M.; Gazzani M. Seasonal energy storage for zero-emissions multi-energy systems via underground hydrogen storage. Renewable Sustainable Energy Rev. 2020, 121, 109629.10.1016/j.rser.2019.109629. - DOI
    1. Acar C.; Dincer I. Review and evaluation of hydrogen production options for better environment. J. Cleaner Prod. 2019, 218, 835–849. 10.1016/j.jclepro.2019.02.046. - DOI
    1. Epelle E. I.; Obande W.; Udourioh G. A.; Afolabi I. C.; Desongu K. S.; Orivri U.; Gunes B.; Okolie J. A. Perspectives and prospects of underground hydrogen storage and natural hydrogen. Sustainable Energy Fuels 2022, 6, 3324–3343. 10.1039/D2SE00618A. - DOI
    1. Tarkowski R. Underground hydrogen storage: Characteristics and prospects. Renewable Sustainable Energy Rev. 2019, 105, 86–94. 10.1016/j.rser.2019.01.051. - DOI

LinkOut - more resources