. 2024 Sep 14;81(1):403.
doi: 10.1007/s00018-024-05436-4.

Protein tyrosine phosphatase receptor type O serves as a key regulator of insulin resistance-induced α-synuclein aggregation in Parkinson's disease

Affiliations

Protein tyrosine phosphatase receptor type O serves as a key regulator of insulin resistance-induced α-synuclein aggregation in Parkinson's disease

Shichuan Tan et al. Cell Mol Life Sci. .

Abstract

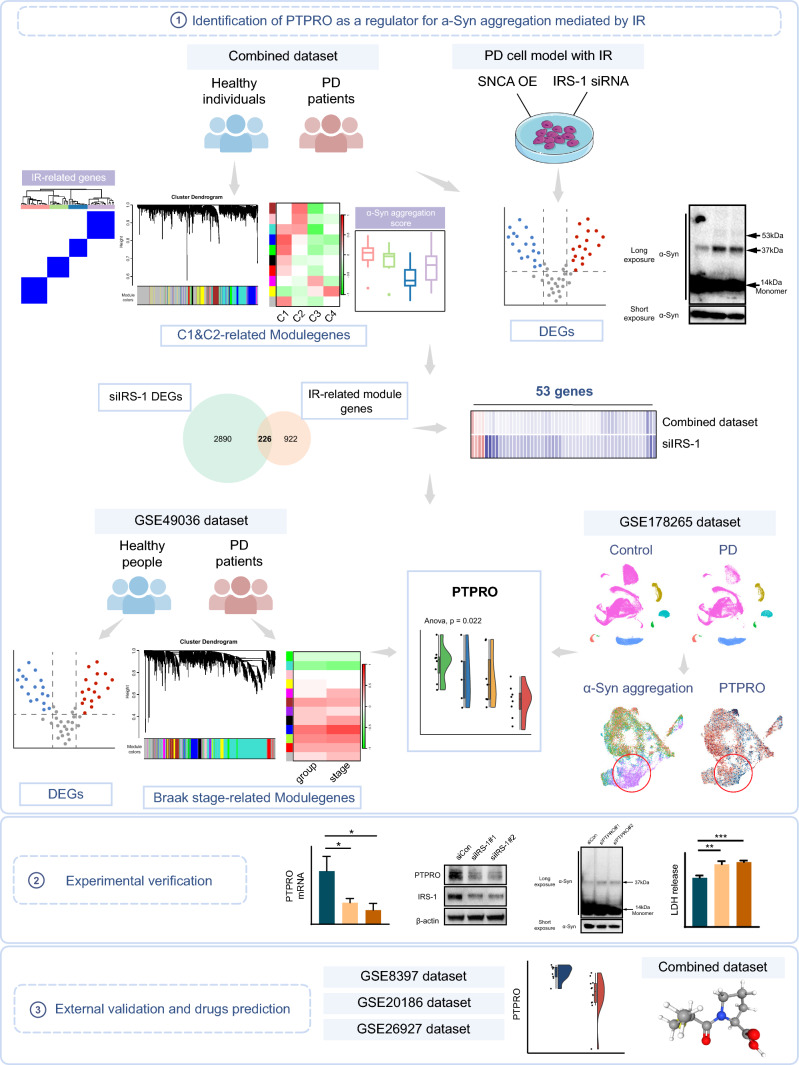
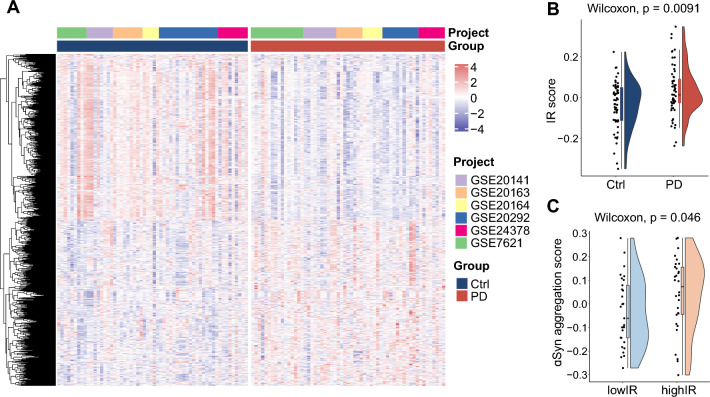
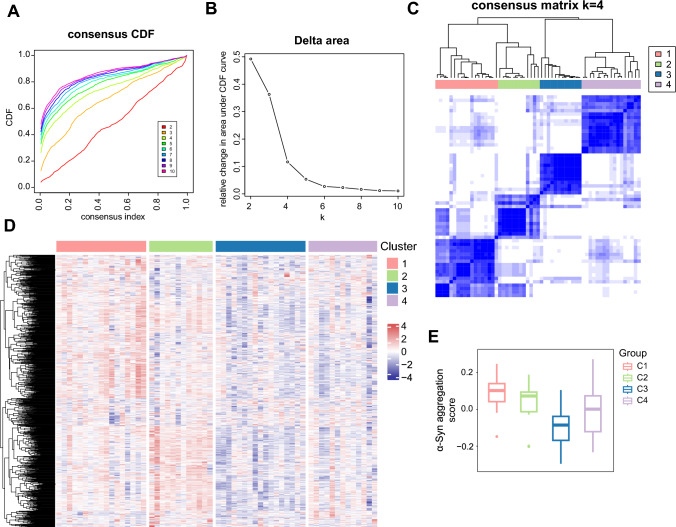
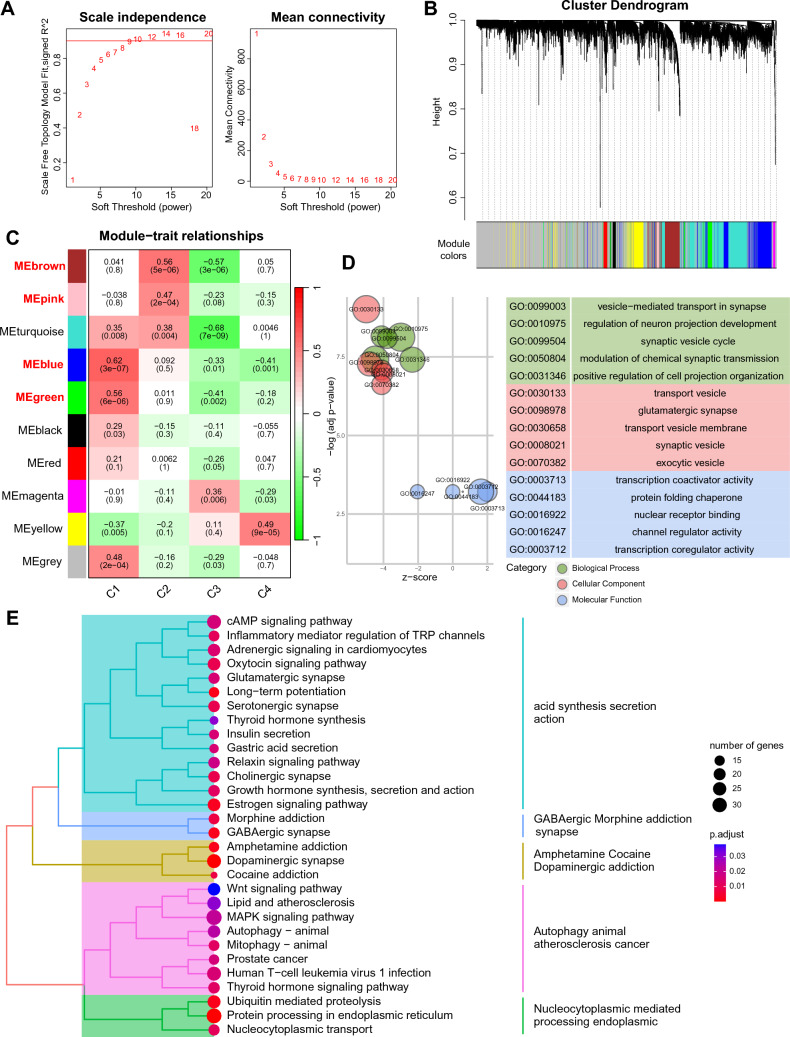
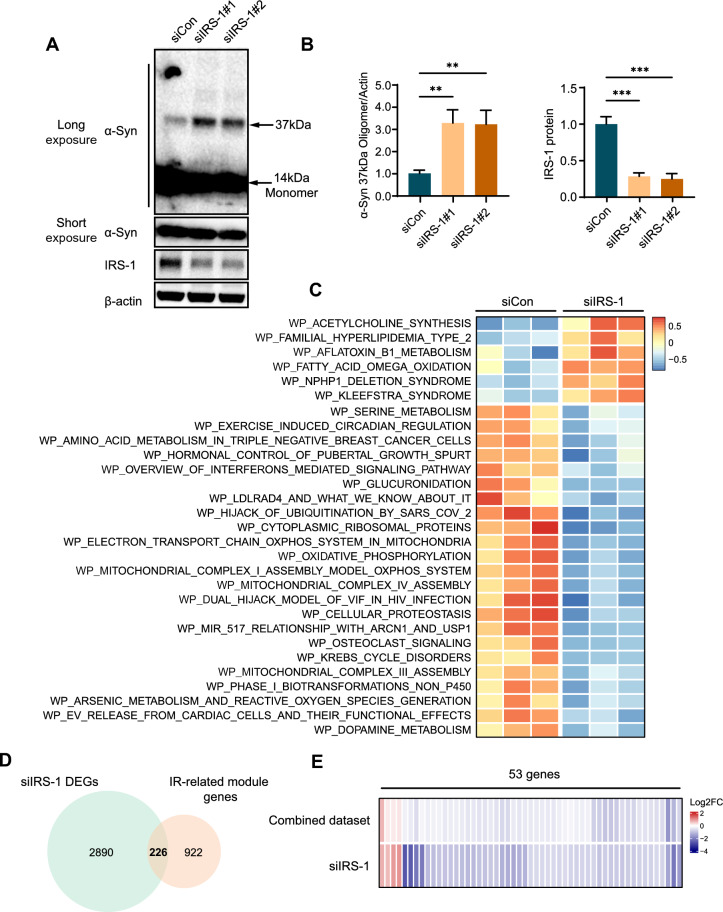
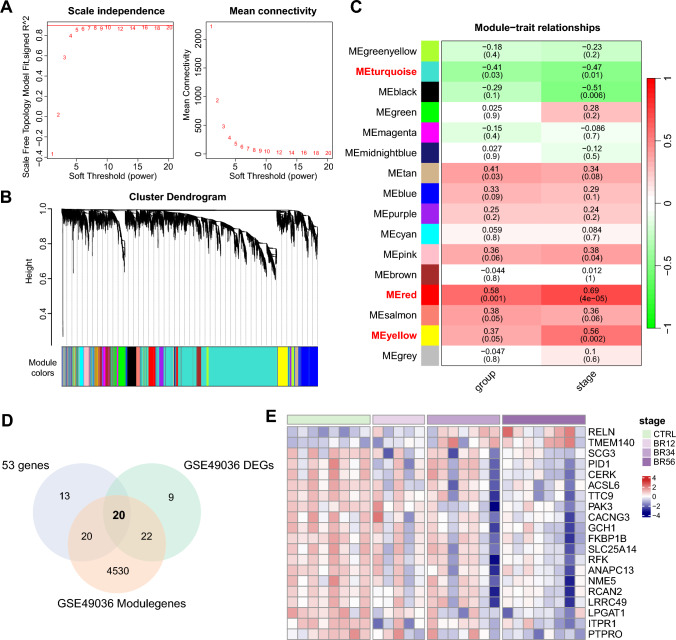
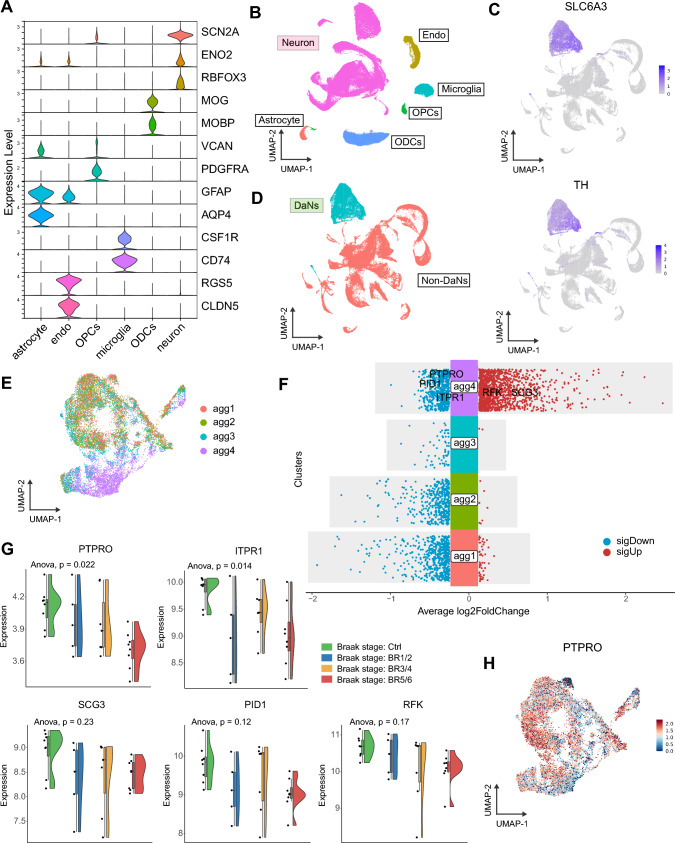
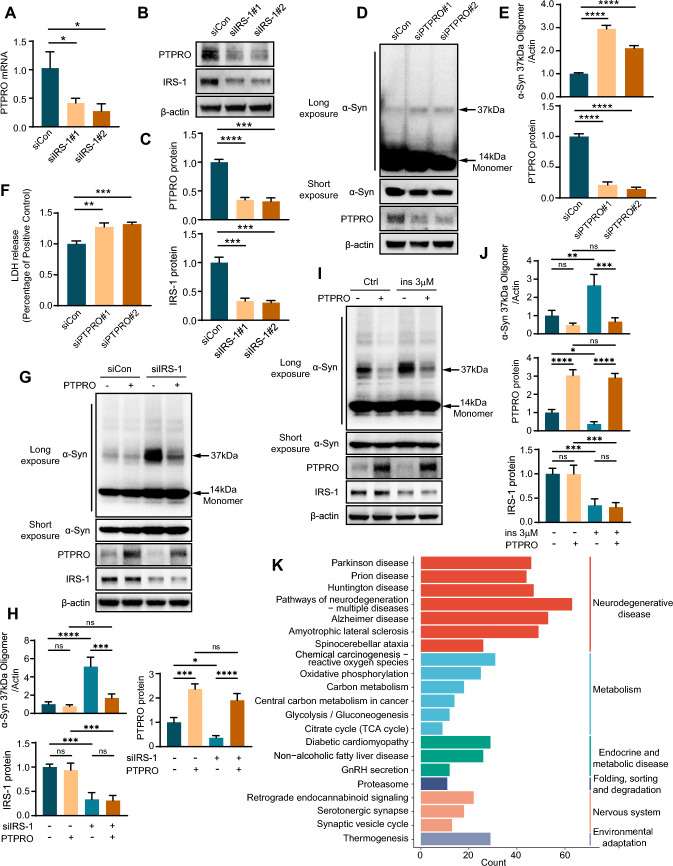
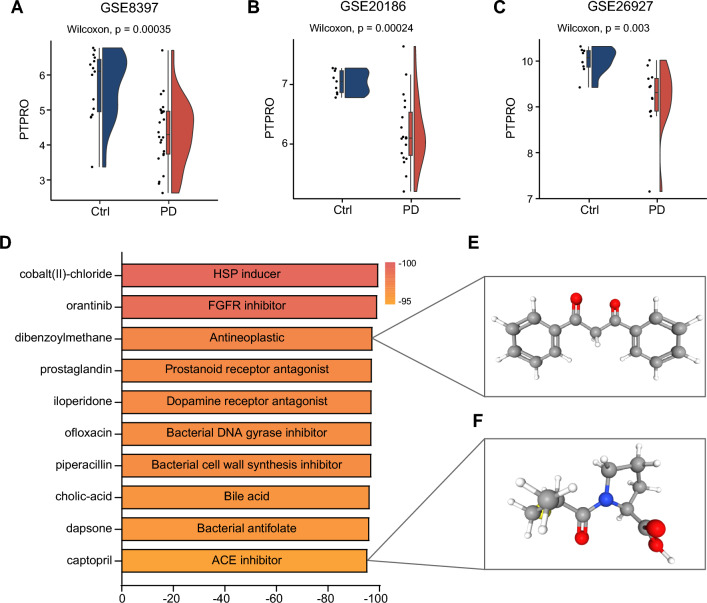
Insulin resistance (IR) was found to be a critical element in the pathogenesis of Parkinson's disease (PD), facilitating abnormal α-synuclein (α-Syn) aggregation in neurons and thus promoting PD development. However, how IR contributes to abnormal α-Syn aggregation remains ill-defined. Here, we analyzed six PD postmortem brain transcriptome datasets to reveal module genes implicated in IR-mediated α-Syn aggregation. In addition, we induced IR in cultured dopaminergic (DA) neurons overexpressing α-Syn to identify IR-modulated differentially expressed genes (DEGs). Integrated analysis of data from PD patients and cultured neurons revealed 226 genes involved in α-Syn aggregation under IR conditions, of which 53 exhibited differential expression between PD patients and controls. Subsequently, we conducted an integrated analysis of the 53 IR-modulated genes employing transcriptome data from PD patients with different Braak stages and DA neuron subclasses with varying α-Syn aggregation scores. Protein tyrosine phosphatase receptor type O (PTPRO) was identified to be closely associated with PD progression and α-Syn aggregation. Experimental validation in a cultured PD cell model confirmed that both mRNA and protein of PTPRO were reduced under IR conditions, and the downregulation of PTPRO significantly facilitated α-Syn aggregation and cell death. Collectively, our findings identified PTPRO as a key regulator in IR-mediated α-Syn aggregation and uncovered its prospective utility as a therapeutic target in PD patients with IR.

Keywords: Dopaminergic neurons; Insulin resistance; PTPRO; Parkinson’s disease; α-Synuclein aggregation.


Conflict of interest statement

The authors declare no conflict of interest.

Figures

Fig. 1
Fig. 1
Schematic workflow of the study
Fig. 2
Fig. 2
IR score in PD patients is higher and is correlated with α-Syn aggregation score. A Transcriptome profile heatmap for PD and control nigrostriatal (SN) samples in the combined dataset. B The IR score was calculated utilizing the GSVA method for both PD and control samples. C The α-Syn aggregation score was evaluated using GSVA among PD patients with varying IR scores
Fig. 3
Fig. 3
Four PD subtypes identified based on IR-related genes. A Consensus clustering cumulative distribution function (CDF) plot depicting consensus distributions for k = 2 to k = 10. B Delta area plot displaying the relative changes in the area under the CDF curve for each k. C Consensus clustering matrix of 59 PD samples when k = 4. D Heatmap demonstrating the differences among the four groups based on gene expression data. E The α-Syn aggregation scores of the four IR-related PD subtypes
Fig. 4
Fig. 4
Identification of modules in PD subtypes with high α-Syn aggregation score. A Soft thresholds determined based on the scale-free fit index and the mean connectivity. B Hierarchical cluster tree of co-expression modules. C Correlations between module genes and PD subtypes. D GO analysis of the high α-Syn aggregation PD subtypes-related module genes on biological processes, cellular components, and molecular functions. E KEGG pathways enriched in the module genes related to PD subtype with high α-Syn aggregation
Fig. 5
Fig. 5
Screening of IR-mediated genes promoting α-Syn aggregation in DA neurons. A α-Syn overexpressing DA neurons were transfected with siIRS-1 or siCon. IRS-1 and monomeric and oligomeric α-Syn were detected via WB. B Quantification of (A). ***P < 0.005, **P < 0.01. Data are shown as the means ± SEMs. C Heatmap of significantly differentially enriched pathways between the siCon and siIRS-1 groups. D Venn diagram of the intersection of DEGs between the PD cell model with and without IR and IR-related module genes. E Heatmap visualization of 53 overlapping genes obtained by intersecting IR-modulated genes and DEGs in the combined dataset between PD and control samples
Fig. 6
Fig. 6
Identification of twenty hub genes associated with PD progression by WGCNA. A Analysis of the scale-free fit index and the mean connectivity to determine the soft threshold. B Cluster dendrogram of co-expression modules in GSE49036. C Correlations between module genes and clinical traits. D Twenty overlapping genes were identified by intersecting the DEGs between PD and control samples with the Braak stage-related module genes, and by determining the intersection with the aforementioned 53 genes, as depicted in a Venn diagram. E Heatmap of the expression of the twenty genes in the different Braak stages
Fig. 7
Fig. 7
SnRNA-seq revealed a significant correlation between PTPRO and α-Syn aggregation. A Violin plots of marker genes for the six cell subtypes. B UMAP plot of cell identity. C UMAP plots of specific markers (SLC6A3 and TH) for DA neurons. D UMAP plot of neuron subtype identity. E UMAP plot of four DA neuron subsets classified by the α-Syn aggregation score. F The DEGs of each cluster were identified by the FindAllMarkers function of the Seurat package. Five out of the twenty hub genes were indicated in the agg4 subset-specific DEGs. G The expression of PTPRO, ITPR1, SCG3, PID1, and PFK in groups across different Braak stages in GSE49036. H PTPRO expression in DA neurons displayed in the UMAP plot
Fig. 8
Fig. 8
Reduced PTPRO expression detected under IR condition facilitates α-Syn aggregation in the PD cell model. siIRS-1 or siCon was transfected into α-Syn overexpressing LUHMES cells. The mRNA expression of PTPRO was analyzed using RT-qPCR (A), and the protein was determined using WB (B). C Quantification of (B). D α-Syn overexpressing LUHMES cells were transfected with PTPRO siRNA (siPTPRO) or negative control (siCon). WB was performed to detect PTPRO, as well as monomeric and oligomeric α-Syn. E Quantification of (D). F LDH assay was applied to assess cell death. G Lentivirus expressing PTPRO or control was introduced into LUHMES cells overexpressing a-Syn under control or IRS-1 knockdown conditions. WB assay was performed to assess the protein levels of monomeric and oligomeric α-Syn, PTPRO, and IRS-1. H Quantification of (G). I LUHMES cells overexpressing α-Syn were transduced with lentivirus expressing PTPRO or control, and treated with or without 3 μM insulin as indicated. Protein levels of monomeric and oligomeric α-Syn, PTPRO, and IRS-1 were assessed by WB assay. J Quantification of (I). K KEGG pathway analysis was conducted on DEGs between the high-PTPRO expression group and the low-PTPRO expression group in PD patients from the combined dataset. ****P < 0.0001, ***P < 0.005, **P < 0.01, *P < 0.05. The data are shown as the means ± SEMs
Fig. 9
Fig. 9
Validation of downregulated PTPRO expression in multiple PD datasets, and prediction of compound targeting for PTPRO. PTPRO expression between PD and control samples in external datasets GSE8397 (A), GSE20186 (B), GSE26927 (C). D Candidate small-molecule compounds affecting downstream of PTPRO predicted by CMap. 3D structures of dibenzoylmethane (E) and captopril (F), retrieved from the PubChem database

References

    1. Reaven GM (2005) The insulin resistance syndrome: definition and dietary approaches to treatment. Annu Rev Nutr 25:391–406 10.1146/annurev.nutr.24.012003.132155 - DOI - PubMed
    1. DeFronzo RA, Ferrannini E, Groop L, Henry RR, Herman WH, Holst JJ et al (2015) Type 2 diabetes mellitus. Nat Rev Dis Primers 1:15019 10.1038/nrdp.2015.19 - DOI - PubMed
    1. Milstein JL, Ferris HA (2021) The brain as an insulin-sensitive metabolic organ. Mol Metab 52:101234 10.1016/j.molmet.2021.101234 - DOI - PMC - PubMed
    1. Mieczkowski J, Kocyk M, Nauman P, Gabrusiewicz K, Sielska M, Przanowski P et al (2015) Down-regulation of IKKβ expression in glioma-infiltrating microglia/macrophages is associated with defective inflammatory/immune gene responses in glioblastoma. Oncotarget 6:33077–33090 10.18632/oncotarget.5310 - DOI - PMC - PubMed
    1. Craft S, Watson GS (2004) Insulin and neurodegenerative disease: shared and specific mechanisms. Lancet Neurol 3:169–178 10.1016/S1474-4422(04)00681-7 - DOI - PubMed

MeSH terms

Substances

LinkOut - more resources