. 2025 Jan;23(1):20-35.
doi: 10.1111/pbi.14474. Epub 2024 Sep 14.

A gain-of-function mutation at the C-terminus of FT-D1 promotes heading by interacting with 14-3-3A and FDL6 in wheat

Affiliations

A gain-of-function mutation at the C-terminus of FT-D1 promotes heading by interacting with 14-3-3A and FDL6 in wheat

Yuting Li et al. Plant Biotechnol J. 2025 Jan.

Abstract

Vernalization and photoperiod pathways converging at FT1 control the transition to flowering in wheat. Here, we identified a gain-of-function mutation in FT-D1 that results in earlier heading date (HD), and shorter plant height and spike length in the gamma ray-induced eh1 wheat mutant. Knockout of the wild-type and overexpression of the mutated FT-D1 indicate that both alleles are functional to affect HD and plant height. Protein interaction assays demonstrated that the frameshift mutation in FT-D1eh1 exon 3 led to gain-of-function interactions with 14-3-3A and FDL6, thereby enabling the formation of florigen activation complex (FAC) and consequently activating a flowering-related transcriptomic programme. This mutation did not affect FT-D1eh1 interactions with TaNaKR5 or TaFTIP7, both of which could modulate HD, potentially via mediating FT-D1 translocation to the shoot apical meristem. Furthermore, the 'Segment B' external loop is essential for FT-D1 interaction with FDL6, while residue Y85 is required for interactions with TaNaKR5 and TaFTIP7. Finally, the flowering regulatory hub gene, ELF5, was identified as the FT-D1 regulatory target. This study illustrates FT-D1 function in determining wheat HD with a suite of interaction partners and provides genetic resources for tuning HD in elite wheat lines.

Keywords: ELF5; FAC; FT‐D1; heading date; plant height; wheat.


Conflict of interest statement

The authors declare no conflict of interest.

Figures

Figure 1
Figure 1
A single nucleotide insertion in FT‐D1 promoted HD in the eh1 wheat mutant. (a, b) Association analysis based on DNA bulks from extremely early and late heading F2 plants. Two biological replicates were performed to filter out false positives. The dotted‐red lines represent the 99th percentile of the fitted ED4 value. (c) Validation of HD locus in the F2 population by QTL mapping on chromosome 7D with 12 SNP‐derived KASP markers. (d) Verification of the single nucleotide insertion in FT‐D1 eh1 by Sanger sequencing. The exons and introns were shown as rectangles and solid lines, respectively. The red rectangle in the Sanger diagram indicates, compared to the wild‐type, a single base insertion at the third exon in FT‐D1 eh1 . (e) Comparison of average HD in F2 plants with different FT‐D1 genotypes. (f) Expression profiling of FT‐D1 in eh1 mutant and wild‐type at different developmental stages. Leaf samples were collected at nine different growth stages according to the Zadoks scale system. Expression levels were normalized based on the endogenous control gene Actin. Error bars indicated the standard deviation of three biological replicates. (g) Rhythmic expression of FT‐D1 eh1 and FT‐D1 WT under long‐day (16 h light/8 h dark) and short‐day (8 h light/16 h dark) conditions. Asterisks indicate significant differences based on the Student's t‐test. *P < 0.05.
Figure 2
Figure 2
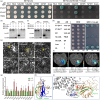
FT‐D1 eh1 interacted with 14‐3‐3A and FDL6 proteins to regulate the expression of flowering‐related genes. (a) Yeast two‐hybrid (Y2H) analysis of the interaction of FT‐D1 eh1/WT with FDL2, FDL6, TaNaKR3, TaNaKR5, TaFTIP5, and TaFTIP7. Yeast cells co‐transformed with the BD‐bait and AD‐prey vectors were plated on SD/−Trp‐Leu and SD/−Trp‐Leu‐His‐Ade‐X‐α‐gal. BD, pGBKT7; AD, pGADKT7. GST pull‐down assays to analyse the interaction of FT‐D1 eh1/WT with MBP‐FDL6 (b) and MBP‐14‐3‐3A (c). GST‐ and MBP‐tagged proteins were recognized by anti‐GST and anti‐MBP antibodies in the Western blot experiment, respectively. (d) Y2H assay analysis of FT‐D1 eh1 interacting with 14‐3‐3A protein, and 14‐3‐3A interacting with FDL6. The pGADT7‐T was co‐transformed with pGBKT7–53 or pGBKT7–Lam to serve as positive or negative controls, respectively. DDO, SD/−Trp‐Leu; QDO, SD/−Trp‐Leu‐His‐Ade. (e) Protein interaction analyses between FT‐D1 eh1/WT and 14‐3‐3A, FDL6; and between 14‐3‐3A and FDL6 as revealed by BiFC assays in tobacco leaves. Scale bar = 30 μm. (f) Luciferase complementation imaging (LCI) assays validated the protein interactions of FT‐D1 eh1/WT‐14‐3‐3A, FT‐D1 eh1/WT‐FDL6, and 14‐3‐3A‐FDL6 in tobacco leaves. (g) Relative expression of 12 flowering‐related genes in the spikes of eh1 and WT plants at the heading stage. Data were shown as mean ± SD; P values were determined by two‐tailed Student's t‐test. *P < 0.05; **P < 0.01; ns, no significant difference. (h) Modelling of FT‐D1 structure based on the rice Hd3a structure. The residue Y85, Segment B, and the frameshift mutation in FT‐D1 eh1 were highlighted with different colours. (i) Modelling FT‐D1‐14‐3‐3A interacting surfaces based on the rice FAC.
Figure 3
Figure 3
Functional characterization of different FT‐D1 alleles in knockout and overexpression wheat lines. (a) CRISPR/Cas9‐mediated gene editing of a conserved target site in FT1 obtained four mutant plants with different genotypes in the three homoeologues. The triple ft1 mutant harboured a heterozygous mutation in the D copy and was, therefore, designated as ‘ft1‐aabbDd KO’. PAM sequences were highlighted in red and target sequences in homoeologues were underlined. The deletions were indicated by red minus and insertions were highlighted in bold red. (b) Phenotype of the three knockout lines (left) and three overexpression lines (right) at the heading stage. Scale bar = 5 cm. (c) Spike morphology of the three knockout lines and three overexpression lines at the late heading stage. Scale bar = 2 cm. (d) Statistical analyses of HD, plant height, spike length, and spikelet number per spike in the knockout and overexpression wheat lines. Error bars represented mean ± SD; P values were determined by two‐tailed Student's t‐test. *P < 0.05; **P < 0.01; ns, no significant difference. (e) SEM observation of the young spikes in ft‐D1 KO, FT‐D1 OE, and corresponding WT plants at the floret differentiation stage. Spikelet was indicated in red numbers. GP, glume primordium; LP, lemma primordium; PP, pistil primordium; SP, stamen primordium; Scale bar = 200 μm. (f) Plant architecture of ft‐D1 KO, FT‐D1 OE, and corresponding WT plants at the maturity stage. Scale bar = 6 cm. (g) Comparison of the peduncle and internodes length in Fielder, ft‐D1 KO, and FT‐D1 OE wheat lines. (h) Cytological observation of the longitudinal section of the peduncles in Fielder, ft‐D1 KO, and FT‐D1 OE wheat lines at the late heading stage. Scale bar = 200 μm. (i) Statistical analysis of cell number in the peduncles of Fielder, ft‐D1 KO, and FT‐D1 OE wheat lines. Data were shown as mean ± SD; P values were determined by two‐tailed Student's t‐test. *P < 0.05; **P < 0.01.
Figure 4
Figure 4
RAN‐seq analyses identified ELF5 as a key gene regulated by FT‐D1. (a) Venn diagram of the differentially expressed genes (DEGs) in ft‐D1 KO and FT‐D1 OE lines. DEGs were defined as adjusted P value <0.05 and |log2FC| ≥ 1. Each line was analysed with three biological replicates. (b) GO enrichment analyses of DEGs that were contrastingly regulated in ft‐D1 KO and FT‐D1 OE. (c) Hierarchy clustering of co‐expression gene modules generated in WGCNA analysis. Different modules were highlighted in different colours. Under the modules, squares with different colours indicated the significance of module‐HD association. (d) Association analyses of the 12 modules from WGCNA analysis with HD. Numbers in the bracket and above indicated the P and correlation coefficient values, respectively. (e) Correlation of gene significance (GS) and module membership (MM) in the turquoise module. GS indicated the correlation of a given gene with HD. MM represented the correlation of a given gene with the module. (f) The expression weight network of 11 genes indicated ELF5‐2D was an important hub gene in the turquoise module. (g) Heatmap of selected DEGs from both ft‐D1 KO and FT‐D1 OE lines or only identified from FT‐D1 OE lines. (h) Validation of the 6 selected DEGs by qRT‐PCR assays. Data were shown as mean ± SD; *P < 0.05; **P < 0.01; ns, no significant difference.
Figure 5
Figure 5
Functional characterization of TaNaKR5 and TaFTIP7 in CRISPR/Cas9‐mediated knockout wheat lines. (a) Mutant identification of positive nakr5 KO lines generated by gene editing assays. The homoeologous‐conserved target sequences in TaNaKR5 were indicated by red lines and the target sequences were underlined. PAM sequences were highlighted in red. The deletions were indicated by red minus, and insertions were highlighted in bold red. Phenotypes of the seven nakr5 KO mutant plants at the heading stage (b) and maturity stage (c). Scale bar = 5 cm. (d) Spike morphology of the seven nakr5 KO plants at the late heading stage. Scale bar = 2 cm. (e) Statistical analysis of the HD, plant height, spike length, and spikelet number per spike in the seven nakr5 KO mutant lines. (f) Mutant identification of positive ftip7 KO mutants generated by gene editing assays. (g) Phenotypes of the four ftip7 KO mutant plants at the heading stage, Scale bar = 5 cm. (h) Spike morphology of the four ftip7 KO mutant lines at the late heading stage. Scale bar = 2 cm. (i) Statistical analysis of HD, plant height, spike length, and spikelet number per spike in the four ftip7 KO mutant plants. Error bars represented the mean ± SD; P values were determined by two‐tailed Student's t‐test. *P < 0.05; **P < 0.01; ns, no significant difference.
Figure 6
Figure 6
Molecular characterization of FT‐D1 and its four interacting partners. (a) Transient expression of GFP‐tagged FT‐D1, FDL6, TaNaKR5, TaFTIP7, and 14‐3‐3A proteins driven by the CaMV 35S promoter in wheat protoplasts. After 16 h of transformation, wheat protoplasts were observed using a confocal microscope. Scale bar = 5 μm. (b) Tissue‐specific expression patterns of FDL6, TaNaKR5, TaFTIP7, and 14‐3‐3A in Fielder at the heading stage. Expression levels were normalized to the wheat Actin gene. Error bars indicate the mean ± SD. Different letters indicate significant differences at P < 0.05. (c) Relative expression of FT‐D1, TaNaKR5, 14‐3‐3A, and FDL6 in the leaves of the four ftip7 KO mutants at the heading stage. (d) Relative expression of FT‐D1, TaFTIP7, 14‐3‐3A, and FDL6 in the leaves of the seven nakr5 KO mutants at the heading stage. (e) Relative expression of TaNaKR5, TaFTIP7, 14‐3‐3A, and FDL6 in the spikes of the FT1 knockout and FT‐D1 overexpression lines at the heading stage. Error bars indicate the mean ± SD; *P < 0.05; **P < 0.01; ns, no significant difference. Protein accumulation of FT‐D1 in the leaves and spikes of the seven nakr5 KO mutants (f) and the four ftip7 KO mutants (g) at the floret differentiation stage. FT‐D1 was detected by FT‐D1 antibodies generated in this study. Wheat Actin gene was used as endogenous control.
Figure 7
Figure 7
A putative model depicting how the gain‐of‐function mutation in FT‐D1eh1 promoted HD in wheat.

References

    1. Abe, M. , Kobayashi, Y. , Yamamoto, S. , Daimon, Y. , Yamaguchi, A. , Ikeda, Y. , Ichinoki, H. et al. (2005) FD, a bZIP protein mediating signals from the floral pathway integrator FT at the shoot apex. Science 309, 1052–1062. - PubMed
    1. Ahn, J.H. , Miller, D. , Winter, V.J. , Banfield, M.J. , Lee, J.H. , Yoo, S.Y. , Henz, S.R. et al. (2006) A divergent external loop confers antagonistic activity on floral regulators FT and TFL1. EMBO J. 25, 605–614. - PMC - PubMed
    1. Beales, J. , Turner, A. , GriYths, S. , Snape, J.W. and Laurie, D.A. (2007) A Pseudo‐Response Regulator is misexpressed in the photoperiod insensitive Ppd‐D1a mutant of wheat (Triticum aestivum L.). Theor. Appl. Genet. 115, 721–733. - PubMed
    1. Bonnin, I. , Rousset, M. , Madur, D. , Sourdille, P. , Dupuits, C. , Brunel, D. and Goldringer, I. (2007) FT genome A and D polymorphisms are associated with the variation of earliness components in hexaploid wheat. Theor. Appl. Genet. 116, 383–394. - PubMed
    1. Chen, X. , Xiong, H. , Guo, H. , Chen, S. , Zhao, L. , Xie, Y. , Gu, J. et al. (2024) Mapping and identification of a reverse mutation of Rht2 that enhances plant height and thousand grain weight in an elite wheat mutant induced by spaceflight. Plant Physiol. Biochem. 207, 108425. - PubMed

MeSH terms

LinkOut - more resources