. 2024 Sep 24;43(9):114761.
doi: 10.1016/j.celrep.2024.114761. Epub 2024 Sep 13.

Ligand-induced segregation from large cell-surface phosphatases is a critical step in γδ TCR triggering

Affiliations

Ligand-induced segregation from large cell-surface phosphatases is a critical step in γδ TCR triggering

Fenglei Li et al. Cell Rep. .

Erratum in

Abstract

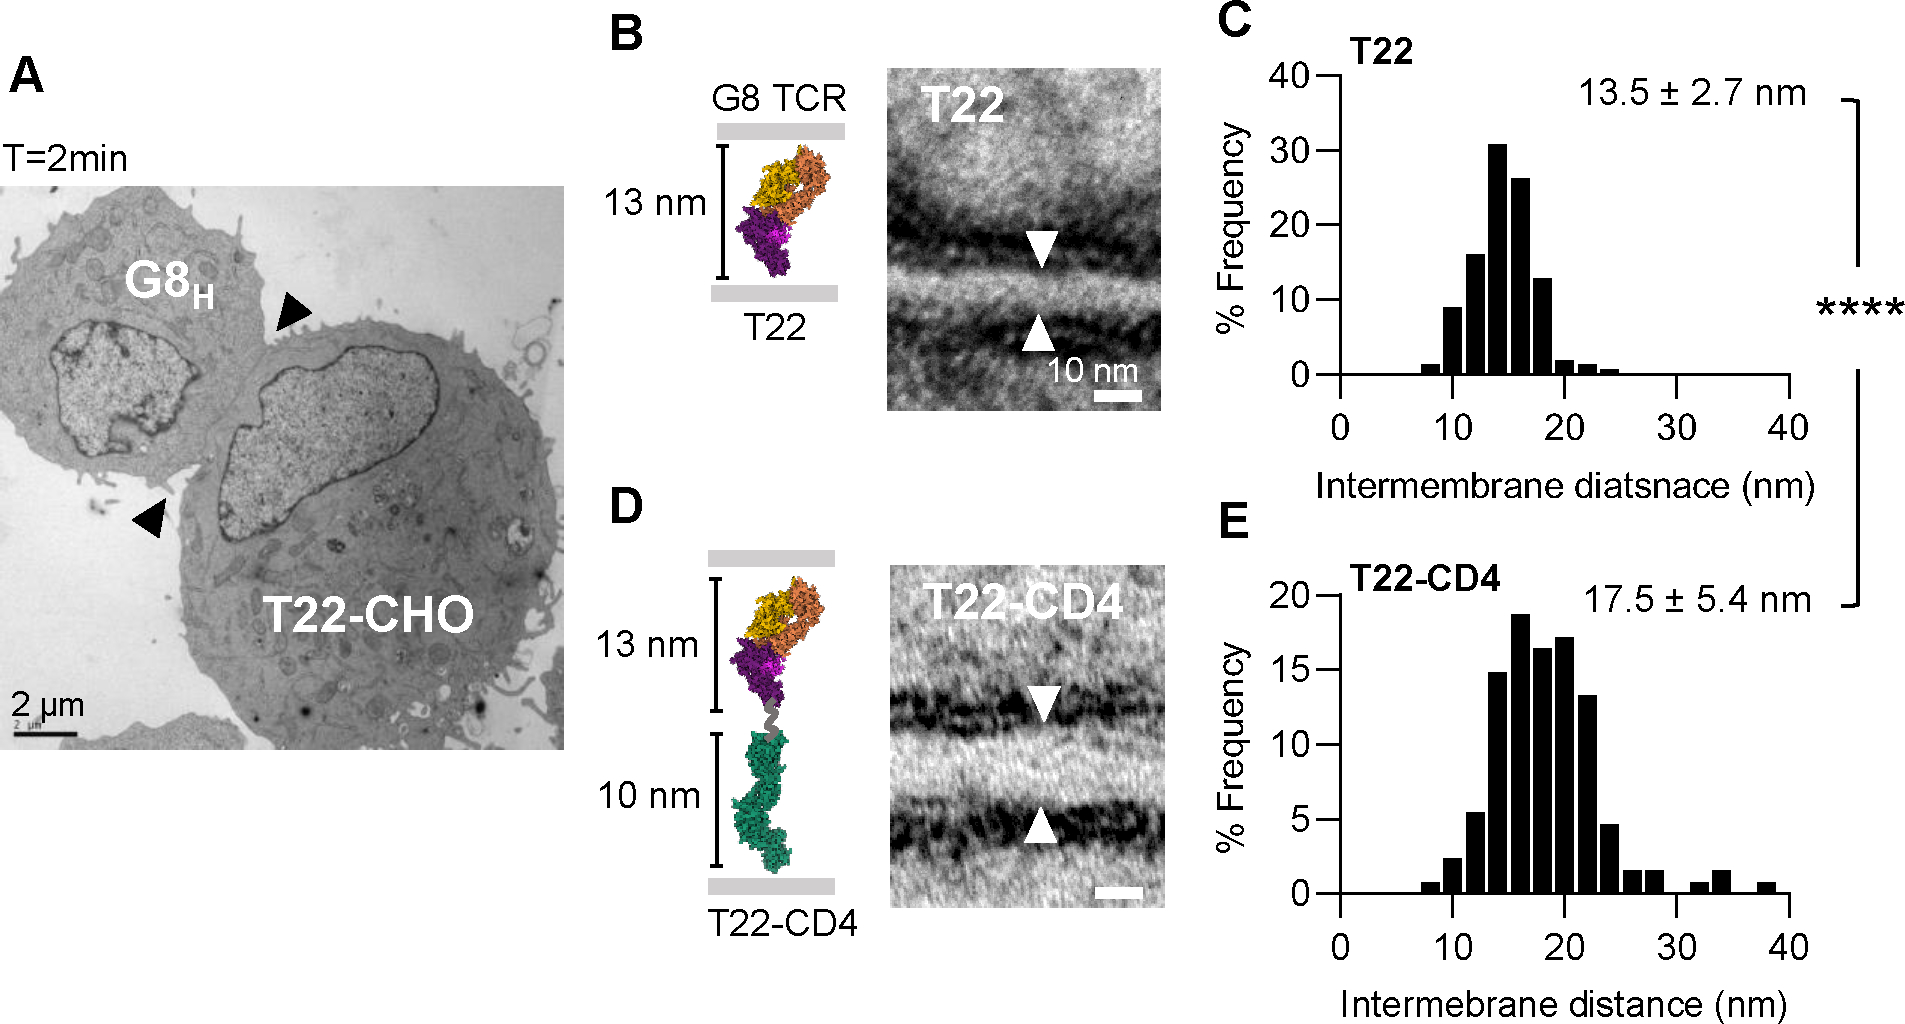
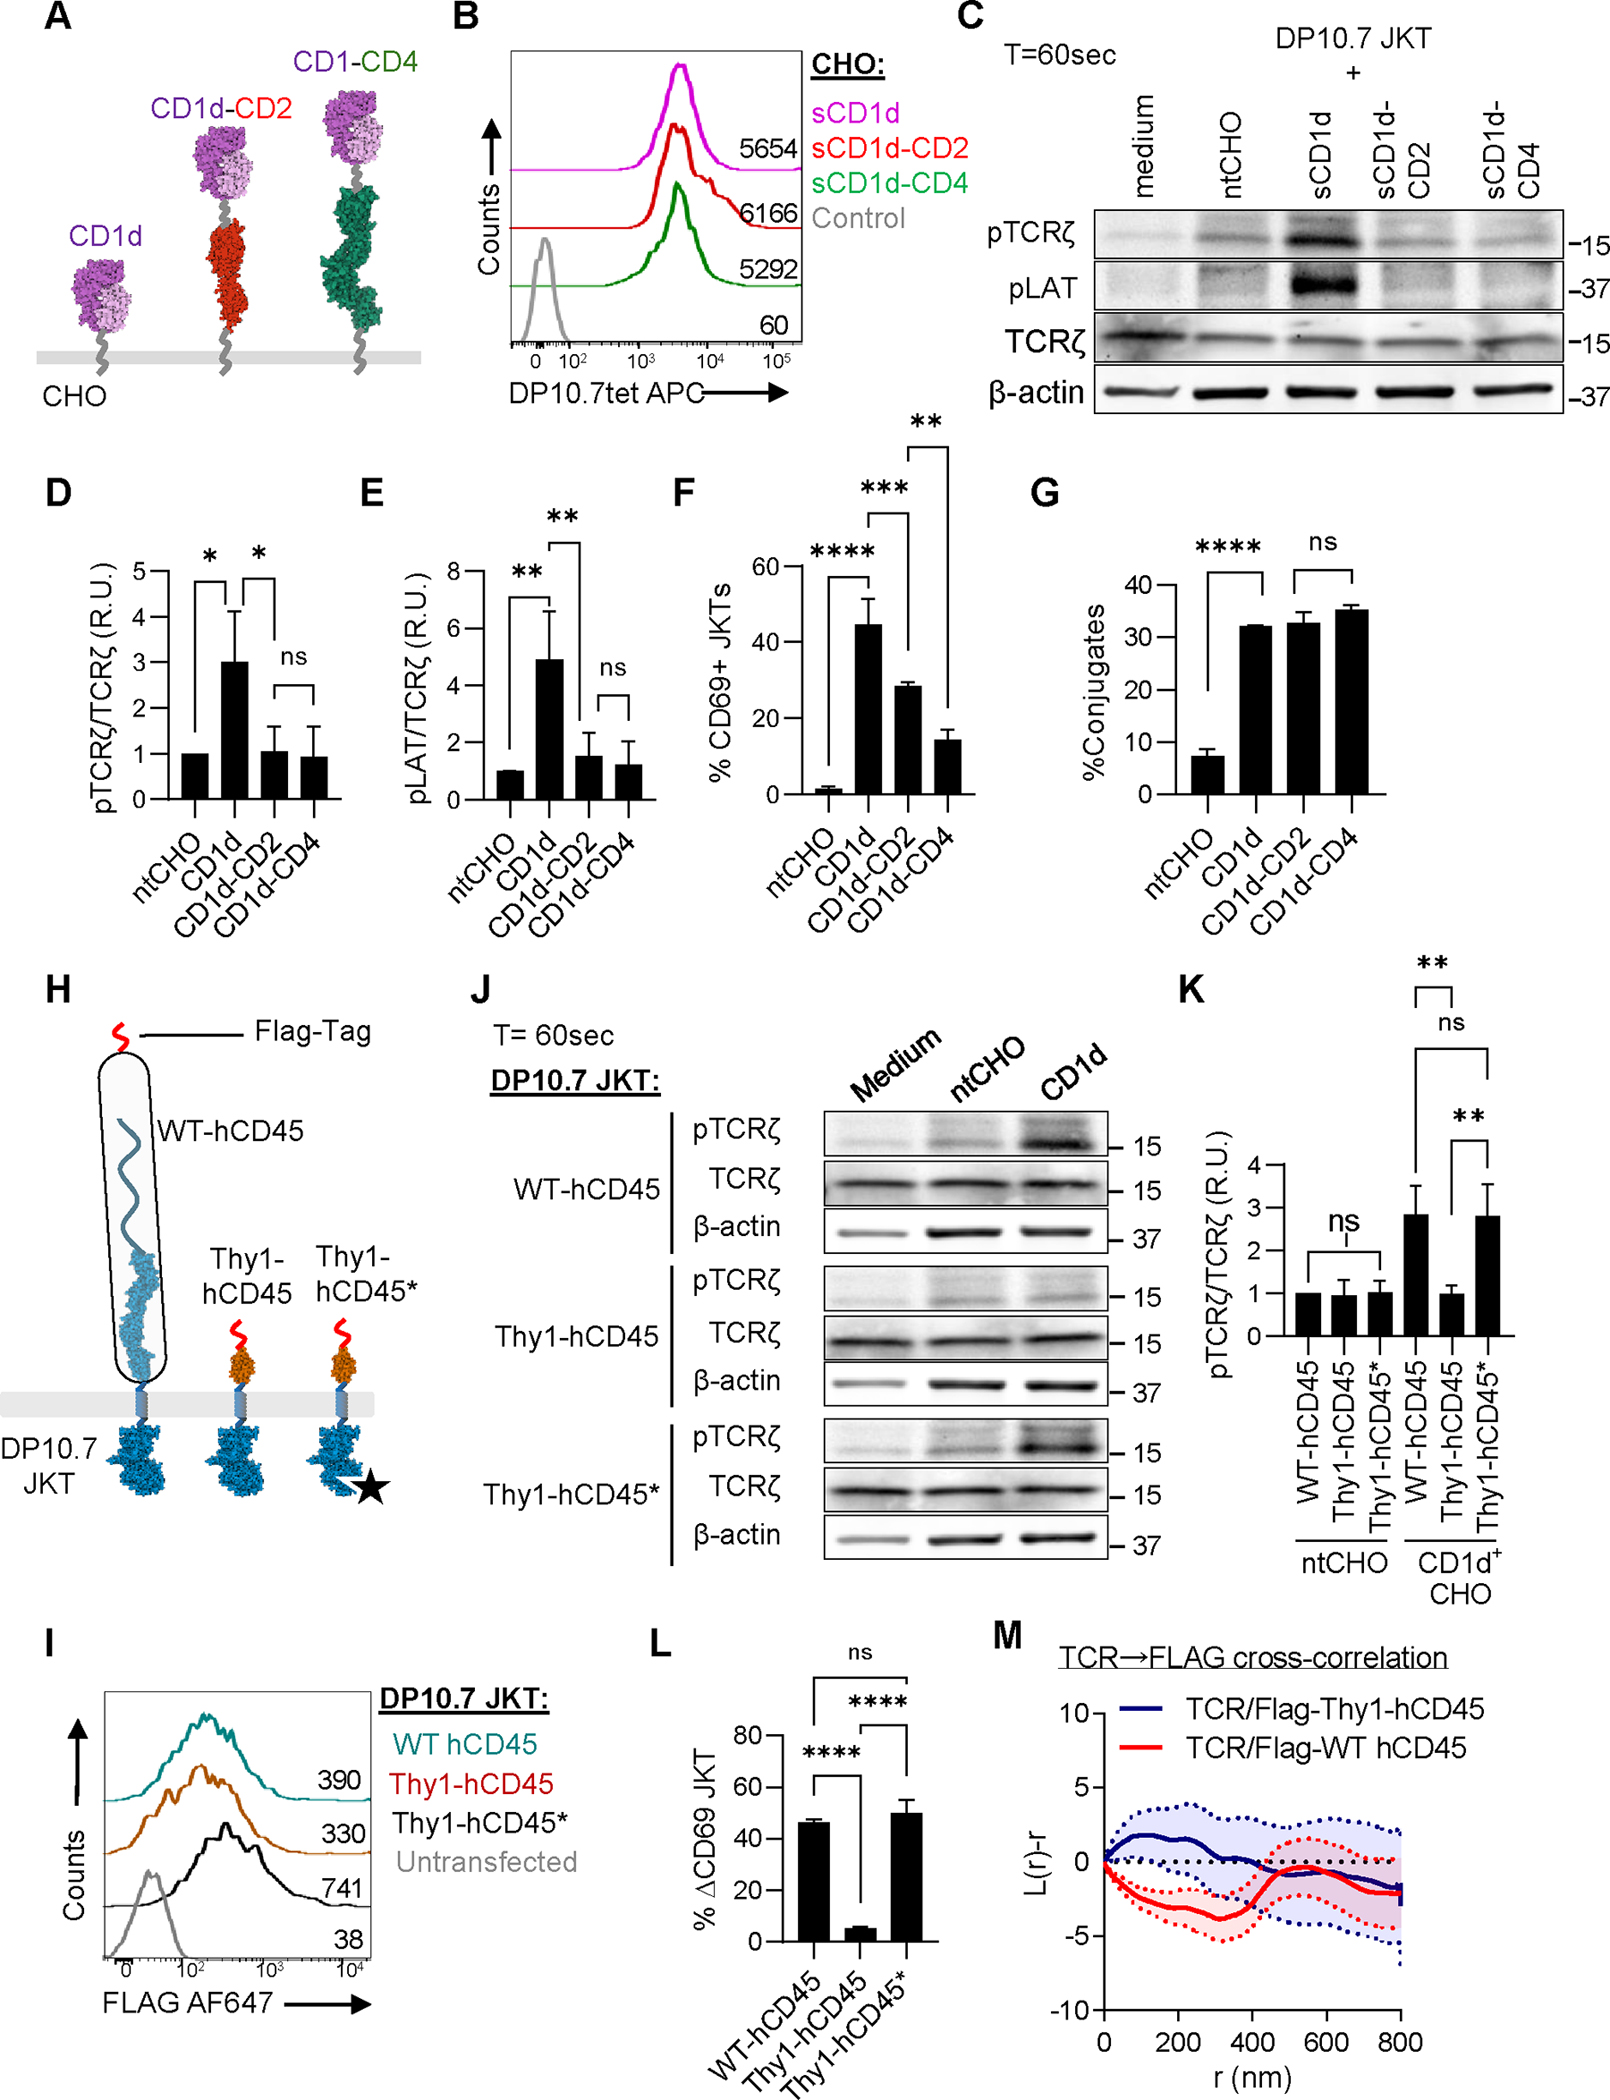
Gamma/delta (γδ) T cells are unconventional lymphocytes that recognize diverse ligands via somatically recombined T cell antigen receptors (γδ TCRs). The molecular mechanism by which ligand recognition initiates γδ TCR signaling, a process known as TCR triggering, remains elusive. Unlike αβ TCRs, γδ TCRs are not mechanosensitive and do not require co-receptors or typical binding-induced conformational changes for triggering. Here, we show that γδ TCR triggering by nonclassical MHC class Ib antigens, a major class of ligands recognized by γδ T cells, requires steric segregation of the large cell-surface phosphatases CD45 and CD148 from engaged TCRs at synaptic close-contact zones. Increasing access of these inhibitory phosphatases to sites of TCR engagement, by elongating MHC class Ib ligands or truncating CD45/148 ectodomains, abrogates TCR triggering and T cell activation. Our results identify a critical step in γδ TCR triggering and provide insight into the core triggering mechanism of endogenous and synthetic tyrosine-phosphorylated immunoreceptors.

Keywords: CD1d; CP: Immunology; T cell receptor; T22; nonclassical MHC antigens; triggering; γδ T cell.


Conflict of interest statement

Declaration of interests E.J.A. declares consultancy with Laguna Therapeutics, TcBioPharm, and Notch on γδ T cell immunotherapy development.

Figures

Figure 1.
Figure 1.. Elongation of murine MHC class Ib molecule T22 abrogates cognate γδ T cell activation.
(A) Structure-based schematic of single-chain constructs of T22 and elongated forms of T22. β2M (pink) is attached to the N-terminus of T22 using a glycine/serine linker. In elongated forms of T22, spacers derived from human CD2 or CD4 are joined to the C-terminus of T22 by glycine/serine linkers (black). All constructs are tethered to the plasma membrane by the mouse H-2Db stalk segment (grey). (B) Histogram cascade plot of surface expression of the indicated T22 constructs in stably transfected CHO cells or untransfected CHO cells (ntCHO), detected using a T22-specific antibody and fluorescently labeled secondary anti-hamster antibody by flow-cytometry. Numbers represent mean fluorescence intensity (MFI) of the associated trace. (C) IL-2 release by cognate γδ G8 T cell hybridomas (G8H) (104/well), co-cultured with increasing numbers of CHO cells expressing comparable levels of the indicated T22 constructs, or with untransfected CHO cells (nt). Results are representative of 3 independent experiments. (D) Cell-cell adhesion assay using a 1:1 mixture of fluorescently-labeled G8H T cells (labeled with CMFDA – green fluorescence) and CHO cells (labeled with Cell Tracker Deep Red – red fluorescence) expressing the indicated T22 constructs. Heteroconjugates were detected by flow-cytometry and quantitated as percentage of events ‘double-positive’ for both G8H T cell-and CHO cell-associated fluorescence. (E) IL-2 release from KN6 γδ T cell hybridomas (KN6H) in response to increasing numbers CHO cells expressing the indicated T22 constructs. (F) IFN-γ release by primary T22-specific primary G8 γδ T cells (G8P) in response to increasing numbers CHO cells expressing the indicated T22 constructs. (G) IL-2 release by primary T22-specific primary G8 γδ T cells (G8P) in response to increasing numbers CHO cells expressing the indicated T22 constructs. Data points in C-F are means ± SD. Means were compared by 1-way ANOVA at APC/T cell ratio=3. ****, P < 0.0001; **, P < 0.01; *, P < 0.05; ns, not significant (P > 0.05); P values are corrected for all-pairwise comparisons. Panels are representative results of 4 independent experiments.
Figure 2.
Figure 2.. G8 γδ TCR triggering is abolished by T22 elongation.
(A) Timeseries of TCRζ phosphorylation, measured by immunoprecipitation of TCR-ζ, followed by SDS-PAGE and immunoblotting with an anti-phosphotyrosine antibody (pY) to detect tyrosine-phosphorylated isoforms (arrows). p21, partially phosphorylated 21 KD ζ isoform, p23, fully phosphorylated ζ isoform. Blots were reprobed to detect unphosphorylated TCR-ζ as a loading control (ζ). Results are representative of 3 independent experiments. (B) Quantitation of immunoblots in A. Results are represented as a normalized ratios of the total optical density of pY bands over that of corresponding TCR-ζ bands, following background subtraction. R.U., relative units. Data are mean ± SD. Means were compared for each timepoint. (C) Histogram cascade plot of TCRζ phosphorylation in G8P T cells following 2 minutes incubation at 37°C with CHO cells expressing the indicated T22 constructs. Cells were stained with a fluorescently-labeled anti-TCRζ pY142 antibody and analyzed by flow-cytometry. ISO, isotype control antibody. Results are representative of 3 independent experiments. (D) Quantitation of TCRζ pY142 staining as in C. Results are presented as background (isotype control)-subtracted MFI. Data are mean ± SD. (E) Representative histogram plots of TCR surface downregulation in G8 γδ T cell hybridomas incubated at 1:1 ratio for 0 to 60 minutes with CHO cells expressing the indicated T22 constructs or untransfected CHO cells (ntCHO). Surface TCR was measured in unpermeabilized samples using a directly-labelled mouse CD3ε-specific antibody and detected by flow-cytometry. Overlays of 0 (grey) and 60 (black) minute timepoints are shown. (F) Timeseries of TCR surface downregulation, in response to T22, elongated forms of T22, or untransfected CHO cells (nt). Results are presented as percentage of surface TCR fluorescence relative to T=0 levels. Results are representative of 3 independent experiments. Data are mean ± SD. Means at T=60s were compared. Means were compared by 1-way ANOVA corrected for all pairwise comparison. *, P < 0.05; **, P < 0.01; ***, P < 0.001; ****, P < 0.0001; ns, not significant (P > 0.05).
Figure 3.
Figure 3.. T22 elongation increases intermembrane spacing and at G8 T cell synaptic contacts.
(A) Representative heteroconjugate between a G8H T cell and CHO cell expressing T22. Arrowheads indicate G8-CHO cell synapse along which intermembrane distance of apposed plasma membranes were measured. (B), (D). Left, Structure-based cartoon of T22 and elongated T22-CD4 constructs with estimated dimensions of ectodomains. Flexible 5 residue glycine/serine linker joining T22 to the CD4 spacer is shown in grey; Right, Representative high-magnification image of a region of synaptic contact between G8H T cell and CHO cells expressing T22 or T22-CD4. Arrowheads indicate region at which intermembrane distance measurements were made, at which G8H T cell and CHO cell plasma membranes are parallel and orthogonal to the imaging plane, as indicated by their ‘tram-line’ morphology. (C), (E). Frequency distribution of intermembrane distances at synaptic contacts. A total of 189 measurements along synaptic contacts were taken from 15 conjugates between G8 T cell hybridomas and CHO cells expressing T22, and 117 measurements were taken from 18 conjugates with CHO cells expressing T22-CD4. Measurements were pooled from three independent experiments. Mean intermembrane distance ± SD is shown in each panel. Means were compared by two-tailed t-test. ****, P < 0.0001.
Figure 4.
Figure 4.. T22 ectodomain size controls CD45 segregation from TCR at G8 T cell synapses.
(A) Representative confocal fluorescence images of conjugates of primary G8 T cells (G8P) with CHO cells expressing T22 or T22-CD4, or with nontransfected CHO cells (ntCHO) as a control. TCR (red) and CD45 (green) were labeled using specific primary antibodies and fluorescently labeled secondary F(ab’)2 fragments. Fluorescence images of T cells in boxed regions of differential interference contrast (DIC) images are shown in right panels. Arrowheads indicate position of synaptic interface in DIC image. (B) and (C), Quantitation of TCR (B.) and CD45 (C.) at synaptic contacts expressed as the ratio of [mean plasma membrane fluorescence intensity at synaptic interface]/[mean plasma membrane fluorescence intensity in non-synaptic region]. Each datapoint represents measurements from one T cell:CHO cell conjugate, red bars indicate means. Results are pooled from 6 independent experiments. Means were compared by 1-way ANOVA corrected for all pairwise comparisons. (D) Representative DIC image of G8P T cell with CHO cells expressing T22 or T22-CD4 (left). Yellow dotted line and arrowheads indicates xz plane sampled in fluorescence image z-stacks of TCR (red) and CD45 (green) labeled as in A. to reconstruct en face views of the synaptic interface (middle panels). Overlays of fluorescence intensities of TCR and CD45 along linescans positioned across en face synapse reconstructions (white dotted line) are shown in right panels. (E) Quantitation of colocalization between TCR and CD45 at reconstructed en face synaptic interfaces using Pearson’s correlation coefficient (PCC). Each datapoint represents measurements from one T cell:CHO cell conjugate, red bars indicate means. Means were compared by two-tailed t-test. *, P < 0.05; ****, P < 0.0001; ns, not significant (P > 0.05); P values are corrected for all pairwise comparisons. Results are pooled from 5 independent experiments.
Figure 5.
Figure 5.. Truncation of the CD45 and CD148 ectodomains abrogates γδ TCR triggering and T cell activation.
(A) Schematic of wild-type CD45 (shown for comparison), and chimeras of the wild-type CD45 cytoplasmic domain fused to the ectodomains of CD43 (CD43-CD45) or Thy-1 (Thy1-CD45), depicted approximately to scale. Also shown is a chimera of a catalytically inactive mutant of the CD45 endodomain fused to the Thy-1 ectodomain (Thy1-CD45*). All constructs contain an N-terminus Flag-Tag (shown in red), and were stably expressed in G8 T cell hybridomas (G8H). (B) Fluorescence histograms of cell-surface levels of the indicated CD45 chimeras (αFlag), endogenous CD45 and TCR (CD3ε), in G8H T cell transductants. CD43-CD45 transductants were stained with secondary antibody only as a labeling control. G8H T cells were sorted for comparable expression levels of CD45 chimeras. (C) Timeseries of calcium flux fluorescence imaging of Fluo-4-loaded G8H T cells, transduced with the indicated CD45 chimeras, interacting with SLBs containing 100 molecules/μm2 T22 and 350 molecules/μm2 ICAM-1. Images at each time point are centered averages of 25 cells for CD43-CD45, 20 cells for Thy1-CD45, and 30 cells for Thy1-CD45*. Pseudocolor scale indicates Fluo-4 fluorescence intensity in arbitrary units. Scale bar, 5μm. (D) Quantitation of Flou-4 fluorescence intensity over time as a measure of intracellular Ca2+ flux in G8H T cell transductants. Data points are mean ± SEM; N=61 cells (CD43-CD45), 29 cells (Thy1-CD45), 51 cells (Thy1-CD45*), pooled from 4 independent experiments. (E) IL-2 release by indicated G8H T cell transductants in 1:1 co-cultures with CHO cells expressing T22. Results are representative of 5 independent experiments. (F) Schematic of wild-type CD148 (WT-CD148) and an ectodomain truncation retaining two membrane-proximal fibronectin type III domains (2FN3-CD148), trasnduced into G8H T cells, depicted approximately to scale. Also shown is a chimera of a catalytically inactive version of 2FN3-CD148 (2FN3-CD148*). All chimeras have a N-terminal Flag-tag. (G) Fluorescence histograms of cell-surface expression levels of CD148 chimeras (αFlag), endogenous CD148, and TCR (CD3ε), in stably transduced G8H T cells expressing the indicated chimeras. G8H T cells were sorted for comparable surface expression levels of CD148 chimeras. (H) Timeseries of averaged epifluorescence images of Flou-4-labeled G8H T cell transductants expressing the indicated CD148 chimeras, interacting with SLBs as in c. Images at each time point are centered averages of 22 WT-CD148-, 18 2FN-CD148-, and 25 2FN-CD148*-expressing G8H T cells. (I) Quantitation of Flou-4 fluorescence intensity over time as in H. Data points are mean ± SEM. N=46 cells (WT-CD148), 40 cells (2FN-CD148), 38 cells (2FN-CD148dead), pooled from 2 independent experiments. (J) IL-2 release by indicated G8H T cells in 1:1 co-cultures with CHO cells expressing T22. Results are representative of 5 independent experiments. Means were compared by 1-way ANOVA corrected for all pairwise comparisons. Statistical comparisons in (D) and (I) are for data points at T=60s. ****, P < 0.0001; ***, P < 0.001; **, P < 0.01; ns, not significant (P > 0.05).
Figure 6.
Figure 6.. Truncated CD45 fails to segregate from γδ TCR at synaptic contacts.
(A) Left panel, Representative low magnification image of a TIRF-dSTORM Gaussian-filtered overlay of endogenous TCR and CD45 localizations at a G8P T cell synapse, formed on a SLB containing 100 molecules/μm2 T22 and 350 molecules/μm2 ICAM-1 following 2 min. incubation at 37°C. Image intensity approximates localization density. Middle panel, high magnification Gaussian-filtered image of boxed region of left panel. Right panel, Unfiltered localizations of endogenous TCR and CD45 in boxed region of middle panel (each dot represents a single antibody-associated fluorophore localization). (B) Autocorrelation of endogenous TCR and CD45 localizations as a function of distance calculated as Ripley’s H function. Peak values approximate cluster size (nm) and extent of clustering. Graphs represent mean ± SEM of 14 randomly selected ROIs (regions of interest) from 14 synapses of G8P T cells pooled from 3 independent experiments. Shaded envelope within dotted lines represents ± SEM. (C) Cross-correlation of endogenous TCR and CD45 using Ripley’s H function. Negative values indicating dispersion (segregation), and positive values indicate co-clustering. Random distribution represents the mean 2D Poisson distributions from 20 Monte-Carlo simulations. (D) Representative images ofmTIRF-dSTORM Gaussian-filtered overlays of endogenous TCR and CD45 localizations at synapses formed by G8P T cells treated with PP2 or DMSO vehicle. Cells were pretreated for 30 min. and concentrations maintained during synapse formation until fixed with PFA. (E) Cross correlation plot of endogenous TCR and CD45 at synapses in (D). Graphs show mean ± SEM. Data are from 10 ROIs sampled from 10 DMSO treated cells, and 4 ROIs from 4 PP2 treated cells, randomly chosen from a pool of 3 independent experiments. Data show mean ± SEM. (F) G8H T cell transductants forming synapses with SLB as in A.; Left panels, Representative TIRFM-STORM Gaussian-filtered overlays of TCR and the indicated CD45 chimeras (Flag); Middle panels, High magnification images of boxed region in top panels; Right panels, Unfiltered localizations of TCR and CD45 chimeras in boxed regions of middle panels (each dot represents a single fluorophore localization). (G) Cross-correlation of TCR and CD45 chimeras in G8H T cell transductants forming synapses as in F. n: for CD43-CD148 = 29 ROIs, for Thy1-CD148=38 ROIs, for Thy1-CD45* = 84 ROIs. ROIs were randomly chosen from a total of 13 synapses for each condition, pooled from 3 independent experiments. Data are mean ± SEM.
Figure 7.
Figure 7.. Triggering of human γδ TCR DP10.7 by sulfatide-CD1d requires phosphatase segregation.
(A) Schematic of single-chain constructs of human CD1d and elongated forms of CD1d incorporating membrane-proximal mouse CD2 and CD4 spacers. (B) Fluorescence histograms showing cell-surface expression levels of sulfatide-loaded CD1d chimeras in CHO cell transductants. Sulfatide/CD1d complexes were detected with cognate DP10.7 TCR tetramer conjugated with APC. Results are representative of 4 independent experiments. (C) Immunoblot of indicated tyrosine-phosphorylated TCR proximal signaling components (pTCR-ζ and pLAT) following 60 seconds contact at 37°C with CHO cells expressing the indicated CD1d constructs. Results are representative of 3 independent experiments. (D) and (E) Quantitation of TCR and LAT phosphorylation from blots as in (C). Data are presented as ratios of normalized pTCRζ or pLAT density over corresponding normalized TCR density for each lane. R.U., relative units. n=3, data are mean ± SD. (F) Activation of DP10.7 Jurkat T cells co-cultured with CHO cells expressing the indicated constructs for 4hrs at 37°C, depicted as percentage of CD69 positive cells, as measured by flow-cytometry. n=5, data are mean ± SD. (G) Conjugate formation, as a measure of cell-cell adhesion, between fluorescently labeled Jurkat T cells expressing the sulfatide/CD1d-specific TCR DP10.7 (CMFDA) and CHO cells expressing the indicated CD1d chimeras loaded with sulfatide (Celltracker Deep Red). Data are pooled from 3 independent experiments. Data shown are mean+SD. (H) Schematic of expression constructs of wild-type human CD45 (WT-hCD45) and a chimera of the CD45 endodomain fused to the ectodomain of rat Thy-1 (Thy1-hCD45), depicted approximately to scale. Also shown is a chimera of a catalytically inactive human CD45 endodomain mutant fused to the Thy-1 ectodomain (Thy1-hCD45*). All constructs contain an N-terminal Flag-Tag. (I) Fluorescence histograms of cell-surface expression levels of the indicated CD45 chimeras in DP10.7 Jurkat T cell transductants sorted for comparable surface expression. (J) Immunoblot of tyrosine-phosphorylated TCR (pTCRζ) in DP10.7 Jurkat T cell transductants following 60 seconds contact at 37°C with CHO cells expressing CD1d or with untransfected CHO cells as a control (ntCHO). Also shown are Jurkat T cell transductants incubated for 60 seconds at 37°C in medium alone as a baseline control. TCRζ and β-actin were blotted as loading controls. (K) Quantitation of TCR phosphorylation from blots as in (J). Data are presented as normalized ratios of normalized pTCRζ density over corresponding normalized TCR density for each lane. R.U., relative units. n=3, data are mean ± SD. (L) CD69 upregulation, as measured by flow-cytometry, of DP10.7 Jurkat T cell transductants expressing the indicated hCD45 constructs, after 4-hour co-culture with CHO cells presenting the sulfatide-loaded CD1d. Results are presented as percentage change in CD69 surface levels relative to unstimulated cells (% ΔCD69). n=3, data are mean ± SD. (M) Ripley’s H cross-correlation between endogenous TCR and transduced CD45 chimeras at synapses of indicated DP10.7 Jurkat T cell transductants. n: for WT-CD45 = 93 ROIs (from 15 synapses) and for Thy1-CD45 = 33 ROIs (from 11 synapses), pooled from 3 independent experiments. ****, P < 0.0001; ***, P < 0.001; **, P < 0.01; ns, not significant (P > 0.05); P values are corrected for all pairwise comparisons. Data are mean ± SEM.

Update of

References

    1. Papotto PH, Ribot JC, and Silva-Santos B (2017). IL-17(+) gammadelta T cells as kick-starters of inflammation. Nat Immunol 18, 604–611. 10.1038/ni.3726. - DOI - PubMed
    1. Junqueira C, Polidoro RB, Castro G, Absalon S, Liang Z, Sen Santara S, Crespo A, Pereira DB, Gazzinelli RT, Dvorin JD, and Lieberman J (2021). gammadelta T cells suppress Plasmodium falciparum blood-stage infection by direct killing and phagocytosis. Nat Immunol 22, 347–357. 10.1038/s41590-020-00847-4. - DOI - PMC - PubMed
    1. Chien YH, Meyer C, and Bonneville M (2014). gammadelta T cells: first line of defense and beyond. Annu Rev Immunol 32, 121–155. 10.1146/annurev-immunol-032713-120216. - DOI - PubMed
    1. Castro CD, Boughter CT, Broughton AE, Ramesh A, and Adams EJ (2020). Diversity in recognition and function of human gammadelta T cells. Immunol Rev 298, 134–152. 10.1111/imr.12930. - DOI - PubMed
    1. Strominger JL (1989). The gamma delta T cell receptor and class Ib MHC-related proteins: enigmatic molecules of immune recognition. Cell 57, 895–898. 10.1016/0092-8674(89)90326-7. - DOI - PubMed

Substances

LinkOut - more resources