. 2024 Oct 29;39(11):1596-1605.
doi: 10.1093/jbmr/zjae148.

Eiken syndrome with parathyroid hormone resistance due to a novel parathyroid hormone receptor type 1 mutation: clinical features and functional analysis

Affiliations

Eiken syndrome with parathyroid hormone resistance due to a novel parathyroid hormone receptor type 1 mutation: clinical features and functional analysis

Alistair D Calder et al. J Bone Miner Res. .

Abstract

We report on 2 patients of East African ancestry with the same novel homozygous variant in the parathyroid hormone receptor type 1 (PTH1R). Both patients shared skeletal features, including brachydactyly, extensive metacarpal pseudo-epiphyses, elongated cone-shaped epiphyses, ischiopubic hypoplasia, and deficient sacral ossification, suggestive of Eiken syndrome. Strikingly, both patients exhibited clinically manifest parathyroid hormone (PTH) resistance with hypocalcemia and elevated serum phosphate levels. These laboratory and clinical abnormalities initially suggested pseudohypoparathyroidism, which is typically associated with GNAS abnormalities. In both patients, however, a homozygous novel PTH1R variant was identified (c.710 T > A; p.IIe237Asn, p.I237N) that is located in the second transmembrane helical domain. Previously, others have reported a patient with a nearby PTH1R mutation (D241E) who presented with similar clinical features (eg, delayed bone mineralization as well as clinical PTH resistance). Functional analysis of the effects of both novel PTH1R variants (I237N- and D241E-PTH1R) in HEK293 reporter cells transfected with plasmid DNA encoding the wild-type or mutant PTH1Rs demonstrated increased basal cAMP signaling for both variants, with relative blunting of responses to both PTH and PTH-related peptide (PTHrP) ligands. The clinical presentation of PTH resistance and delayed bone mineralization combined with the functional properties of the mutant PTH1Rs suggest that this form of Eiken syndrome results from alterations in PTH1R-mediated signaling in response to both canonical ligands, PTH and PTHrP.

Keywords: Eiken syndrome; GPCR disease variants; PTH1R; calcium homeostasis; delayed ossification; parathyroid hormone resistance.

Plain language summary

Eiken syndrome is rare genetic disorder of skeletal development, 7 due to alterations in the gene for parathyroid hormone receptor type 1 (PTH1R). This receptor can bind 2 hormones: parathyroid hormone (PTH), the body’s main regulator of the level of calcium in blood, and PTH-related peptide (PTHrP), that regulates bone development. We report 2 new cases of Eiken syndrome sharing the same not previously reported change in PTH1R. The patients had typical findings in the skeleton reported in previous cases, but with some variation in the features. Unlike previously reported cases, the 2 patients we describe had low blood calcium levels causing symptoms. We wanted to explore how this new mutation affects the function of the receptor, particularly how it might affect the signals generated when the receptor binds to its 2 t hormones, PTH and PTHrP. We genetically reprogrammed a cell line with the new mutation, and tested those cells’ responses to stimulation by the hormones. We showed that the altered receptor appears unable to bind both hormones in a stable fashion, explaining why the patients showed changes both in the skeleton (due to altered PTHrP signaling) and in the blood level of calcium (due to altered PTH signaling).


Conflict of interest statement

None declared.

Figures

Figure 1
Figure 1
Selected radiographs from a skeletal survey performed in the proband from family 1 at age 5. (a) Hand radiograph demonstrates shortening of the first metacarpal and fourth and fifth proximal phalanges, with associated sleeve-like ossification of the diaphyses (“angel-shaped”; white arrows). There are multiple cone-shaped epiphyses with striking elongation of epiphyses of the third and fourth metacarpals (black arrows), with associated shortening of the metacarpals. Multiple metacarpal pseudo-epiphyses are also noted. (b) Pelvic radiograph shows marked pubic hypoplasia with wide ischiopubic synchondroses. The upper femoral epiphyses are small for age and have an angulated contour. (c) Lateral radiograph of the lumbosacral spine demonstrates partially deficient ossification of the lower sacral elements (white arrowhead). (d) Radiograph of the foot showing hypoplasia of the more lateral rays.
Figure 2
Figure 2
Selected images from a skeletal survey in the proband from family 2 performed at age 11. (a) Hand radiographs demonstrate shortening of the first metacarpals. The fourth and fifth digits are small. There is middle phalangeal hypoplasia. There are multiple metacarpal pseudo-epiphyses. There are cone-shaped epiphyses of the third and fourth metacarpals, which are unusually elongated (white arrows). (b) Pelvic radiograph shows pubic hypoplasia with wide ischiopubic synchondroses, and small and angulated upper femoral epiphyses. (c) Partially deficient ossification of the lower sacrum is shown on the lateral spine radiograph. (d) Radiograph of tibia and fibula shows small lower tibial epiphysis with mild proximal hypoplasia of the fibula.
Figure 3
Figure 3
Chemiluminescence analysis of expression of WT and mutant PTH1Rs on the surface of fixed HEK293/GloSensor (Gs22a) cells. Gs22a cells in 96-well plates and transiently transfected with pCDNA3.1 vector DNA, or vector DNA encoding an HA-tagged PTH1R variant (PTH1R-WT, PTH1R-I237N, or PTH1R-D241E), were fixed with 3.7% paraformaldehyde and incubated with an horse radish peroxidase (HRP)–conjugated anti-HA antibody for 1 hour at 4°C, then rinsed, treated with HRP substrate (luminal), and luminescence was measured in an envision plate reader. The peak luminescence signals at each receptor are shown normalized to PTH1R-WT. Bar heights indicate means ± SEM of 7 experiments with 4–8 replicate wells in each; data points indicate the means of each separate experiment. Abbreviations: HA (Influenza hemagglutinin); ***, p < 0.001; IgG, immunoglobulin G.
Figure 4
Figure 4
Basal and ligand-induced cAMP signaling responses of WT and mutant PTH1Rs. cAMP signaling responses were assessed in Gs22a cells (HEK293-derived cells stably expressing the GloSensor cAMP reporter) that were transiently transfected with plasmid DNA coding for the human PTH1R-WT or a mutant or PTH1R, or with pCDNA3.1 vector DNA. (A) Basal cAMP signaling. Luminescence signals were recorded for 13 minutes after the addition of luciferin (t = 0). The signals were normalized to the peak signal observed in cells expressing PTH1R-WT and plotted vs time after luciferin addition. The final (13’) time points were analyzed by Student’s t test for differences vs PTH1R-WT. **p < .006. (B) Dose–response analysis of PTH(1-34) or PTHrP(1-36) stimulation. Cells preloaded with luciferin were treated with varying concentrations of PTH(1-34) or PTHrP(1-36), and the peak cAMP-dependent luminescence signal recorded, typically occurring ~10–20 minutes after ligand addition, was divided by the basal luminescence observed for that receptor (measured just prior to ligand addition and 13 minutes after luciferin addition) and normalized to the basal-adjusted peak signal observed for that ligand at 100-nM concentration on PTH1R-WT (100%), and is plotted vs ligand concentration. Curves were fit to the data using a sigmoidal nonlinear regression equation, and the resulting curve-fit parameters are reported in Table 2. (C) Time course of cAMP signaling over 20 minutes after addition of PTH(1-34) or PTHrP(1-36) at 1.0-nM concentration. For each ligand on each receptor, the observed luminescence at each time point was divided by the basal luminescence observed for that receptor (measured just prior to ligand addition and 13’ after luciferin addition) and normalized to the basal-adjusted peak response observed for that ligand on PTH1R-WT (100%). Endpoint responses (at 20 minutes) to PTHrP(1-36) were significantly different from PTH1R-WT for PTH1R-I237N and PTH1R-D241E. p Values vs WT: *, .013; **, .0067, respectively. (D) Time course of cAMP signaling after ligand washout. The cells used in the graphs of panel C were rinsed to remove unbound ligand, treated with fresh media containing fresh luciferin, and cAMP-dependent luminescence signals were recorded for an additional 90 minutes. The luminescence signals were normalized to PTH1R-WT as in panel C and plotted vs time after ligand washout (t = 0). One-phase-decay curves were fit to the data between the 16’ and 90’ time points using the nonlinear regression equation Y = (Y0 – plateau) * exp(-K*X) + plateau, where Y0 is the response at t = 0, plateau is the response at infinite time, K is the rate constant, and X is time, which yielded half-life values on WT-PTH1R, I237N-PTH1R, and D241E-PTH1R of 88, 66, and 72 minutes for PTH(1-34), and 27, 17, and 16 minutes for PTHrP(1-34); differences vs WT were not significant. Data are means (±SEM) of 5 (pCDNA mammalian expression vector in panels C and D) 6 or 7 (in panel B) separate experiments. Abbreviations: PTH, parathyroid hormone; PTH1R, parathyroid hormone receptor type 1; PTHrP, parathyroid hormone–related peptide.
Figure 5
Figure 5
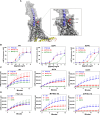
Effects of PTH1R variants on interaction with N-terminal PTH(1-11) and PTH(1-15)–derived fragment peptides. (A) 3-D view of the PTH1R in complex with PTHrP(1-36) and heterotrimeric G protein (cryogenic electron microscopy protein data base file PDB.7VVJ5) showing the receptor shaded gray, the ligand shaded blue, and a portion of GalphaS shaded yellow. Receptor residues R179-T192 at the top of transmembrane helix 1 are removed to better view the N-terminal portion of the ligand. An expanded view is shown of the upper region of the transmembrane domain portion of the receptor to highlight the proximities of receptor residues I237 and D241 (displayed in space-filled format) located in transmembrane helix 2 and the N-terminal region of the ligand (residues 1-11 are shaded dark blue and sidechains of Lys11 and Glu4 are displayed in stick format as reference points). (B–D) cAMP signaling responses (cAMP luminescence area under the curve [AUC]) in GS-22A cells transiently transfected to express PTH1R-WT, PTH1R-I237N, or PTH1R-D241E. (B) Dose–response analysis of cAMP induction by PTH(1-34), M-PTH(1-15), or M-PTH(1-11). For each ligand dose, GloSensor-derived cAMP-dependent luminescence signals were measured at 1-minute intervals for 15 minutes and plotted vs time to obtain AUC values, which are plotted vs ligand concentration. (C) Time courses of the cAMP-dependent luminescence signals, as counts per second (cps) obtained for WT-PTH1R, I237N-PTH1R, and D241E-PTH1R after addition (at t = 0) with PTH(1-34), Modified-PTH (M-PTH)(1-15), or M-PTH(1-11) at the 1 × 10⁻⁹ M concentration. (D) The data shown in panel C were replotted to permit direct comparison of the response of each receptor to each ligand. The final (15’) time points of the time course plots were analyzed by Student’s t test for differences vs PTH(1-34) (C) or vs PTH1R-WT (D). *p < .05. Data are means (±SEM) of 6 separate experiments. Abbreviations: PTH, parathyroid hormone; PTH1R, parathyroid hormone receptor type 1; PTHrP, parathyroid hormone–related peptide.

References

    1. Gardella TJ, Vilardaga JP. International Union of Basic and Clinical Pharmacology. XCIII. The parathyroid hormone receptors–family B G protein-coupled receptors. Pharmacol Rev. 2015;67(2):310-337. 10.1124/pr.114.009464 - DOI - PMC - PubMed
    1. Zhang P, Jobert AS, Couvineau A, Silve C. A homozygous inactivating mutation in the parathyroid hormone/parathyroid hormone-related peptide receptor causing Blomstrand chondrodysplasia. J Clin Endocrinol Metab. 1998;83(9):3365-3368. 10.1210/jcem.83.9.5243 - DOI - PubMed
    1. Eiken M, Prag J, Petersen KE, Kaufmann HJ. A new familial skeletal dysplasia with severely retarded ossification and abnormal modeling of bones especially of the epiphyses, the hands, and feet. Eur J Pediatr. 1984;141(4):231-235. 10.1007/BF00572767 - DOI - PubMed
    1. Duchatelet S, Ostergaard E, Cortes D, Lemainque A, Julier C. Recessive mutations in PTHR1 cause contrasting skeletal dysplasias in Eiken and Blomstrand syndromes. Hum Mol Genet. 2005;14(1):1-5. 10.1093/hmg/ddi001 - DOI - PubMed
    1. Saito H, Noda H, Gatault P, et al. Progression of mineral ion abnormalities in patients with Jansen Metaphyseal chondrodysplasia. J Clin Endocrinol Metab. 2018;103(7):2660-2669. 10.1210/jc.2018-00332 - DOI - PMC - PubMed

Substances