. 2024 Dec 10;74(1):75-88.
doi: 10.1136/gutjnl-2024-332412.

Metabolic reprogramming by mutant GNAS creates an actionable dependency in intraductal papillary mucinous neoplasms of the pancreas

Affiliations

Metabolic reprogramming by mutant GNAS creates an actionable dependency in intraductal papillary mucinous neoplasms of the pancreas

Yuki Makino et al. Gut. .

Abstract

Background: Oncogenic 'hotspot' mutations of KRAS and GNAS are two major driver alterations in intraductal papillary mucinous neoplasms (IPMNs), which are bona fide precursors to pancreatic ductal adenocarcinoma. We previously reported that pancreas-specific Kras G12D and Gnas R201C co-expression in p48Cre; KrasLSL-G12D; Rosa26LSL-rtTA; Tg (TetO-GnasR201C) mice ('Kras;Gnas' mice) caused development of cystic lesions recapitulating IPMNs.

Objective: We aim to unveil the consequences of mutant Gnas R201C expression on phenotype, transcriptomic profile and genomic dependencies.

Design: We performed multimodal transcriptional profiling (bulk RNA sequencing, single-cell RNA sequencing and spatial transcriptomics) in the 'Kras;Gnas' autochthonous model and tumour-derived cell lines (Kras;Gnas cells), where Gnas R201C expression is inducible. A genome-wide CRISPR/Cas9 screen was conducted to identify potential vulnerabilities in KrasG12D;GnasR201C co-expressing cells.

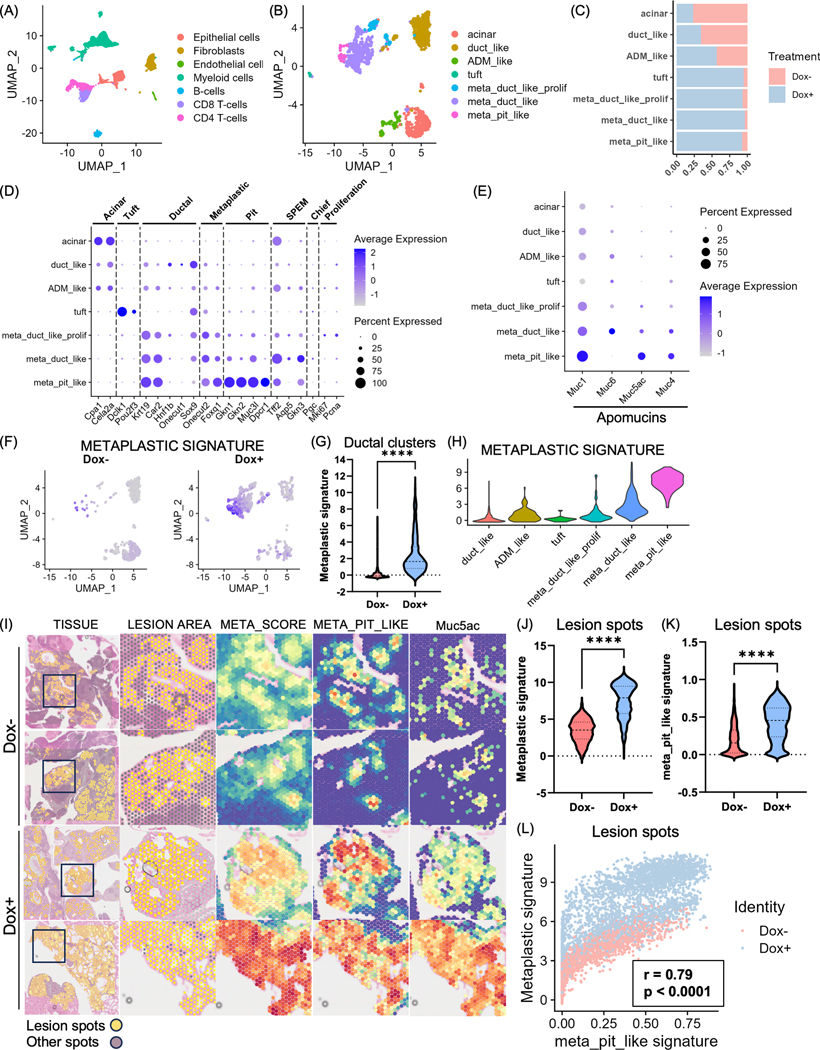
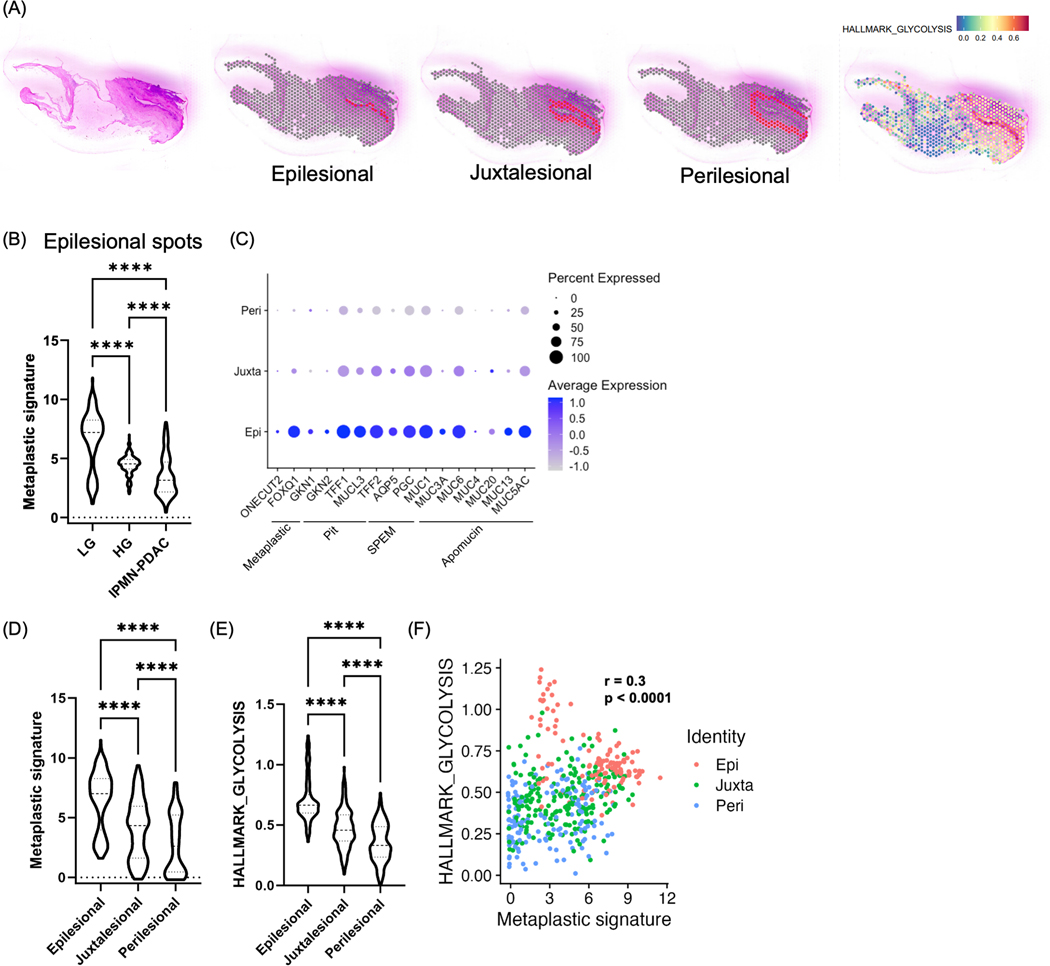
Results: Induction of Gnas R201C-and resulting G(s)alpha signalling-leads to the emergence of a gene signature of gastric (pyloric type) metaplasia in pancreatic neoplastic epithelial cells. CRISPR screening identified the synthetic essentiality of glycolysis-related genes Gpi1 and Slc2a1 in Kras G12D;Gnas R201C co-expressing cells. Real-time metabolic analyses in Kras;Gnas cells and autochthonous Kras;Gnas model confirmed enhanced glycolysis on Gnas R201C induction. Induction of Gnas R201C made Kras G12D expressing cells more dependent on glycolysis for their survival. Protein kinase A-dependent phosphorylation of the glycolytic intermediate enzyme 6-phosphofructo-2-kinase/fructose-2,6-biphosphatase 3 (PFKFB3) was a driver of increased glycolysis on Gnas R201C induction.

Conclusion: Multiple orthogonal approaches demonstrate that Kras G12D and Gnas R201C co-expression results in a gene signature of gastric pyloric metaplasia and glycolytic dependency during IPMN pathogenesis. The observed metabolic reprogramming may provide a potential target for therapeutics and interception of IPMNs.

Keywords: gastric metaplasia; glucose metabolism; oncogenes; pancreatic cancer; pre-malignancy - GI tract.


Conflict of interest statement

Competing interests: AM is listed as an inventor on a patent that has been licensed by Johns Hopkins University to Thrive Earlier Detection. AM serves as a consultant for Tezcat Biosciences.

Figures

Figure 1.
Figure 1.. RNA-sequencing (RNA-seq) reveals transcriptional reprogramming and a gene signature of gastric (pyloric type) metaplasia in Kras;Gnas cells and human IPMNs with aberrant G(s)alpha signaling.
(A) Establishment of 2D cell lines (Kras;Gnas cells; LGKC-1, 2, 3, and 4) from the pancreas of Kras;Gnas model mice and in vitro induction of GNASR201C-expression by doxycycline (Dox). Created with BioRender. (B-G) Kras;Gnas cells were incubated with or without doxycycline for 24 hours before RNA collection for RNA-seq. (B) Fraction of Gnas reads harboring the R201C mutation in doxycycline-treated and untreated Kras;Gnas cells. (C) Volcano plot of Kras;Gnas cell paired (Dox+/Dox-) RNA-seq analysis. Significantly upregulated or downregulated genes (padj<0.05, |log2(FC)| > 1) upon doxycycline treatment are shown in red or blue, respectively. DE; differentially expressed. (D) Heatmap of differentially expressed genes upon doxycycline treatment. FC; fold change. (E) Categories of significant genes sets enriched in doxycycline-treated cells generated through gene set enrichment analysis (GSEA). NES; normalized enrichment score (F) Heatmap of transcripts indicative of gastric (pyloric type) metaplasia, and apomucins in doxycycline-treated cells versus untreated cells. The pyloric type metaplasia signature includes transcripts indicative of both gastric pit and Spasmolytic Polypeptide Expressing Metaplasia (SPEM). (G) GSEA showing the enrichment of gastric pit cell gene signatures in doxycycline-treated cells over untreated cells. FDR; false discovery rate (H-I) Transcriptomic expression data from 36 human IPMN lesions obtained from Reference 15 (Semaan et al., Cancer Research Communications 2023). (H) Volcano plot of differentially expressed genes in GNAS-mutant human IPMNs over GNAS wild-type cases. (I) GSEA showing the enrichment of gastric pit cell gene signatures in GNAS-mutant human IPMNs over GNAS-wild-type cases. *p<0.05, ns; not significant
Figure 2.
Figure 2.. Single-cell RNA-sequencing (scRNA-seq) and spatial transcriptomics (ST) identifies heterogeneous metaplastic duct-like populations with gastric (pyloric type) metaplasia in Kras;Gnas mice with aberrant G(s)alpha signaling.
(A-H) scRNA-seq was performed in the pancreas in Kras;Gnas mice fed with doxycycline (Kras ON, Gnas ON) versus normal diet (Kras ON, Gnas OFF) for 10 weeks (18 weeks of age, N = 2 for each group). (A) Uniform Manifold Approximation and Projection (UMAP) plot of Kras;Gnas scRNA-seq clustered into seven cell type clusters. (B) UMAP plot of the Kras;Gnas epithelial compartment clustered into seven distinct subclusters. (C) Proportion of cells in epithelial subclusters in doxycycline fed (Dox+) versus normal (Dox-) diet fed Kras;Gnas mice. (D) Dot plot showing the expression of representative annotation markers in each epithelial cell cluster. ‘Metaplastic duct-like’, ‘metaplastic pit-like’, and ‘metaplastic duct-like proliferating’ clusters showed upregulation of ductal and metaplastic markers indicative of duct-like origin with metaplastic characteristics. ‘Metaplastic duct-like’ and ‘metaplastic pit-like’ clusters represent gastric (pyloric) metaplasia as evidenced by the upregulation of SPEM and pit cell markers, respectively. (E) Dot plot showing expression of transcripts for cellular apomucins in epithelial cell clusters demonstrates enrichment within metaplastic clusters. (F) Feature plot of the Metaplastic signature score in the Kras;Gnas epithelial compartment. (G) Violin plot of the Metaplastic signature score in the ductal compartment of Kras;Gnas mice as function of doxycycline-treatment. (H) Violin plot of the Metaplastic signature score by ductal cluster identity. (I-L) ST of pancreatic tissues in Kras;Gnas mice fed with normal diet or doxycycline diet for 14 weeks (22 weeks of age,N = 2 per group). (I) Representative areas from spatial analysis of lesion areas in Kras;Gnas mice fed with normal diet or doxycycline diet showing Metaplastic score (META_SCORE), meta pit-like profile score (META_PIT_LIKE) and Muc5ac expression. (J) Metaplastic gene signature in lesion spots from Kras;Gnas mice fed with doxycycline versus normal diet. (K) Meta pit-like profile score in lesion spots from Kras;Gnas mice fed with doxycycline versus normal diet. (G) Correlation of Metaplastic signature and meta pit-like scores in lesion spots from Kras;Gnas mice fed with doxycycline versus normal diet. ****p<0.0001.
Figure 3.
Figure 3.. CRISPR/Cas9 loss-of-function screening identifies glycolysis as an actionable vulnerability in Kras;Gnas cells with aberrant G(s)alpha signaling.
(A) Schematic illustration of genome-wide CRISPR/Cas9 knockout screening of Kras;Gnas cells. Created with BioRender. (B) Venn diagram of shared synthetic lethal genes in the GnasR201C induced (Dox+) LGKC-1 and LGKC-3 cells compared to non-induced (Dox-) cells using genome-wide CRISPR screening. Created with BioRender. (C) CRISPR drop-out screening Z-scores of the relative abundance of guides for each gene in LGKC-1 and LGKC-3 cells cultured with vs without doxycycline using drugZ. Genes with FDR <0.05 were highlighted in red in cells. (D) Heatmap of differentially expressed glycolysis genes in doxycycline-treated Kras;Gnas cells. CRISPR hits highlighted in red. (E) Glycolysis-related gene sets significantly enriched in bulk RNA-seq of doxycycline-treated Kras;Gnas cells versus untreated cell lines. (F) scGSEA of pancreatic tissues in Kras;Gnas mice fed with normal or doxycycline diet. scGSEA on HALLMARK gene sets in all epithelial cells as a function of doxycycline treatment (upper) or as a function of cluster identity (lower) in Kras;Gnas mice. The ‘metaplastic duct-like’, ‘metaplastic pit-like’ and ‘metaplastic duct-like proliferating’ clusters were combined into a single ‘metaplastic_duct’ cluster. (G-I) ST of the pancreatic tissues in Kras;Gnas mice fed with normal diet or doxycycline diet for 14 weeks (22 weeks of age,N = 2 per group). (G) Spatial analysis of the enrichment of HALLMARK GLYCOLYSIS gene signature in Kras;Gnas mice fed with doxycycline versus normal diet. (H) HALLMARK GLYCOLYSIS gene signature score in lesion spots in doxycycline-fed Kras;Gnas mouse and normal diet-fed Kras;Gnas mouse. (I) Scatter plot showing correlation between metaplastic gene signature and HALLMARK GLYCOLYSIS gene signature in all lesion spots. r = Pearson correlation coefficient *p<0.05, **p<0.01, ***p<0.001, ****p<0.0001.
Figure 4.
Figure 4.. Spatial transcriptomics of human IPMNs validates glycolysis signature within neoplastic epithelium concomitant with metaplastic signature.
Spatial transcriptomic dataset of human IPMN samples were obtained from Reference 12 (Sans, et al. Cancer Discovery 2023). (A) Mapping of Epilesional, Juxtalesional, and Perilesional areas, and HALLMARK-GLYCOLYSIS genes signature in a representative low-grade IPMN sample. (B) Violin plot of Metaplastic signature score in low-grade/gastric (LG, N = 7) IPMNs, high-grade (HG, N = 3) IPMNs, and IPMN-derived PDAC (IPMN-PDAC, N = 3). (C) Dot plot of the expression of metaplastic and IPMN markers as a function of tissue region in LG samples (N = 7). (D) Violin plot showing enrichment of the Metaplastic gene signature in Epilesional spots relative to Juxtalesional and Perilesional spots in LG samples (N = 7). (E) Enrichment of the HALLMARK GLYCOLYSIS gene signature in Epilesional spots relative to Juxtalesional and Perilesional spots in LG samples (N = 7). (F) Scatter plot showing the correlation between the Metaplastic and HALLMARK GLYCOLYSIS gene signature scores in LG samples (N = 7).
Figure 5.
Figure 5.. Real-time metabolic analysis identifies increased glycolytic flux following induction of mutant GNAS in vitro and in vivo.
(A-B) Five independent Kras;Gnas cell lines (LGKC-1, 2, 3, 4, and 5) were analyzed. Cells were incubated with or without 100 ng/mL doxycycline for 24 hours before analysis. The average value of 4 replicates is shown for each cell line, all replicates are shown in Supplementary Figure 5. (A) Glucose uptake assay of Kras;Gnas cells incubated with or without doxycycline. (B) Lactate secretion assay of Kras;Gnas cells incubated with or without doxycycline. (C) Real-time cell metabolic analysis with Seahorse XF Glycolytic Rate Assay to determine the effect of GNASR201C induction on basal glycolysis. Cells were incubated with or without 100 ng/mL doxycycline for 24 hours before the assay. Proton Efflux Rate (PER) was sequentially measured under basal conditions, after inhibition of oxidative phosphorylation by rotenone/antimycin A (Rot/AA), and after inhibition of glycolysis by 2-DG. (D-H) Real-time cell metabolic analysis with 13C-pyruvate hyperpolarized magnetic resonance spectroscopy (MRS) (D) Scheme of 13C-pyruvate hyperpolarized MRS which detects Lactate / Pyruvate signal ratios to calculate glycolytic flux. Created with BioRender. (E) Representative sequential NMR spectra after the addition of approximately 8.7 mM hyperpolarized pyruvate in Kras;Gnas cells incubated with or without doxycycline for 24 hours. The spectrum was collected for every 6 seconds for 180 seconds. The labeled peaks are pyruvate, pyruvate hydrate and lactate. (F) Lactate / Pyruvate signal ratios of Kras;Gnas cells with or without doxycycline treatment. LGKC-1, 2, 3, and 4 cells were independently incubated with or without doxycycline for 24 hours before each assay. (G) Representative T2-weighted MRI (coronal slice) images and real-time in vivo 13C-magnetic resonance spectra after intravenous injection of hyperpolarized pyruvate. The sequential spectra are collected for every 2 seconds for 120 seconds from the MRI slabs on the mouse pancreas. (H) Lactate / Pyruvate signal ratios of the pancreas in Kras;Gnas mice on 13C-pyruvate Hyperpolarized MRI. Kras;Gnas mice fed with normal diet or doxycycline diet for 3–15 weeks were analyzed (N = 6 for each group). *p<0.05, ****p<0.0001.
Figure 6.
Figure 6.. Loss of Gpi1 abolishes glycolysis and attenuates proliferation in GnasR201C-expressing Kras;Gnas cells.
(A) Immunoblot of CRISPR Gpi1 KO Kras;Gnas cells and controls (LacZ). Cells were incubated with 100 ng/mL doxycycline for 24 hours before protein collection. (B) Seahorse XF Glycolytic Rate Assay. Cells treated with 100 ng/mL doxycycline for 24 hours were incubated in the medium containing glucose, glutamine, and pyruvate, followed by the injection of Rot/AA and 2-DG. PER was sequentially measured at indicated time points. (C) Cell proliferation assay. Cell viability was measured by WST-8 assay at indicated time points. Cells were incubated with or without 100 ng/mL doxycycline under glucose replete media. N = 3, technical replicates. (D) Colony formation assay. Cells were stained after 10-day incubation. Cells were incubated with or without 100 ng/mL doxycycline under glucose replete media. (E-G) Allograft injection model of Gpi1 knockout cells. Cells were subcutaneously inoculated to the bilateral flank portion of nude mice (N = 6 tumors per group). Mice were fed with normal diet or doxycycline diet from the day of inoculation. Tumor volumes were measured every 3 or 4 days from day 14 until sacrifice on day 28. (E) Macroscopic appearance of the allograft tumors. (F) Sequential tumor volume after cell inoculation. (G) Tumor volume at the time of sacrifice (day 28). (H) Quantitative PCR analysis for gastric pit cell and spasmolytic polypeptide expressing metaplasia (SPEM) markers in Gpi1-knockout Kras;Gnas cells. Cells were incubated with 100 ng/mL doxycycline for 24 hours before RNA collection. N = 4, technical replicates. *p<0.05, **p<0.01, ***p<0.001, ****p<0.0001.
Figure 7.
Figure 7.. PKA-mediated activation of PFKFB3 is responsible for glycolysis enhancement induced by mutant GNAS.
(A) Immunoblot of glycolysis pathway-related proteins in Kras;Gnas cells. Cells were incubated with or without 100 ng/mL doxycycline for 24 hours before protein collection. (B) Immunoblot in Kras;Gnas cells incubated with or without 10 μM forskolin for 1 hour before protein collection. (C) Immunoblot in Kras;Gnas cells incubated with or without 100 ng/mL doxycycline or 5 μM H-89 for 24 hours before protein collection. (D-E) Kras;Gnas cells were incubated for 24 hours before each assay with or without 100 ng/mL doxycycline or 10 μM PFK-15. (D) Glucose uptake assay in untreated, doxycycline treated or doxycycline + PFK-15 treated Kras;Gnas cells. (E) Lactate secretion assay in untreated, doxycycline treated or doxycycline + PFK-15 treated Kras;Gnas cells. (F) Seahorse XF Glycolytic Rate Assay of Kras;Gnas cells. Cells were incubated with or without 10 μM PFK-15 under 100 ng/mL doxycycline for 24 hours before the assay. During the assay, cells were incubated in the medium containing glucose, glutamine, and pyruvate, followed by the injection of Rot/AA and 2-DG. PER was measured at indicated time points. (G) Dose-response curve and the half maximal inhibitory concentration (IC50) for basal glycolysis on PFK-15 treatment. Kras;Gnas cells were treated with PFK-15 at indicated concentrations with or without 100 ng/mL doxycycline treatment for 24 hours before the assay. Basal glycolysis was measured by Seahorse XF Glycolytic Rate Assay. (H) Immunohistochemistry for phospho-PFKFB3 in human IPMN with or without GNAS mutation (N = 7 for each group). Representative images of GNAS-wild and mutant cases were shown. (I) Scheme of increased glycolysis via mutant G(s)alpha-PKA-PFKFB3 axis. Created with BioRender. *p<0.05, **p<0.01, ***p<0.001, ****p<0.0001.

References

    1. Halbrook CJ, Lyssiotis CA, Pasca di Magliano M, Maitra A. Pancreatic cancer: Advances and challenges. Cell 2023;186:1729–54. - PMC - PubMed
    1. Singhi AD, Koay EJ, Chari ST, Maitra A. Early Detection of Pancreatic Cancer: Opportunities and Challenges. Gastroenterology 2019;156:2024–40. - PMC - PubMed
    1. Wu J, Jiao Y, Dal Molin M, Maitra A, de Wilde RF, Wood LD, et al. Whole-exome sequencing of neoplastic cysts of the pancreas reveals recurrent mutations in components of ubiquitin-dependent pathways. Proc Natl Acad Sci U S A 2011;108:21188–93. - PMC - PubMed
    1. Wu J, Matthaei H, Maitra A, Dal Molin M, Wood LD, Eshleman JR, et al. Recurrent GNAS mutations define an unexpected pathway for pancreatic cyst development. Sci Transl Med 2011;3:92ra66. - PMC - PubMed
    1. Landis CA, Masters SB, Spada A, Pace AM, Bourne HR, Vallar L. GTPase inhibiting mutations activate the alpha chain of Gs and stimulate adenylyl cyclase in human pituitary tumours. Nature 1989;340:692–6. - PubMed

MeSH terms