. 2024 Sep 14;15(1):8068.
doi: 10.1038/s41467-024-52105-y.

Genome-wide discovery and integrative genomic characterization of insulin resistance loci using serum triglycerides to HDL-cholesterol ratio as a proxy

Affiliations

Genome-wide discovery and integrative genomic characterization of insulin resistance loci using serum triglycerides to HDL-cholesterol ratio as a proxy

Natalie DeForest et al. Nat Commun. .

Abstract

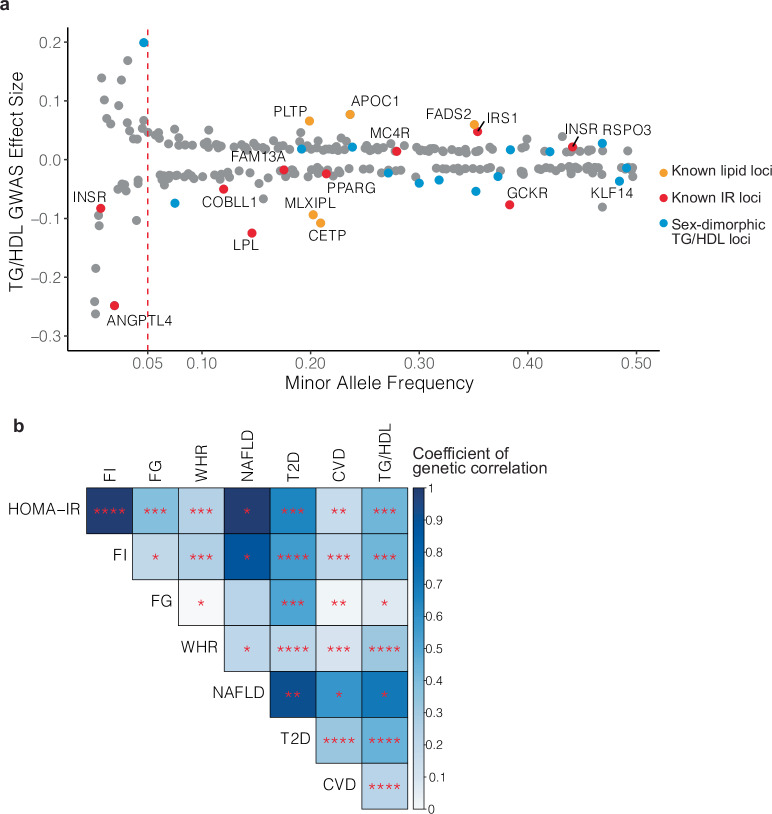
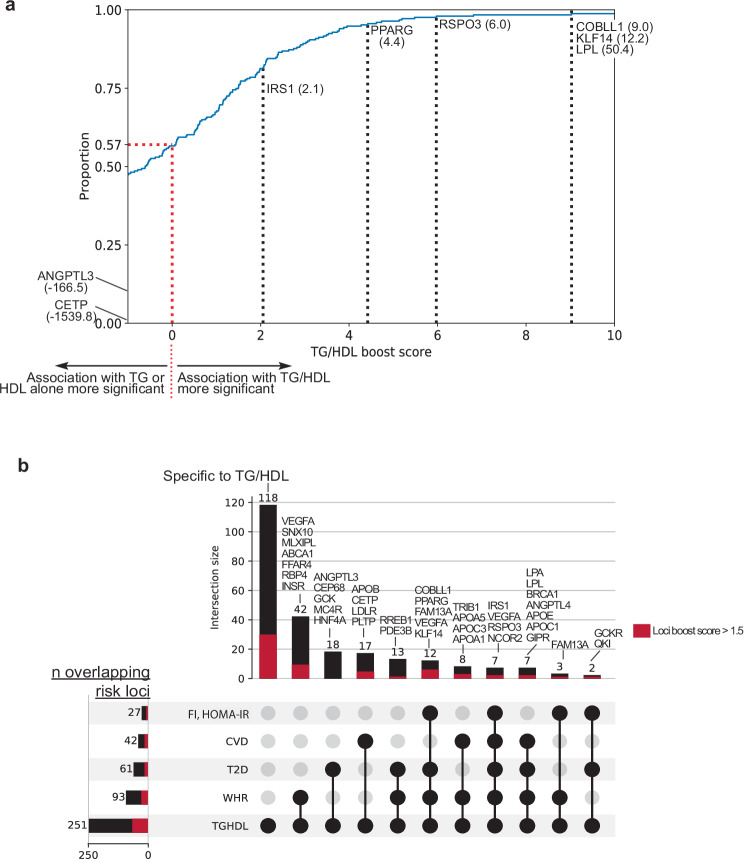
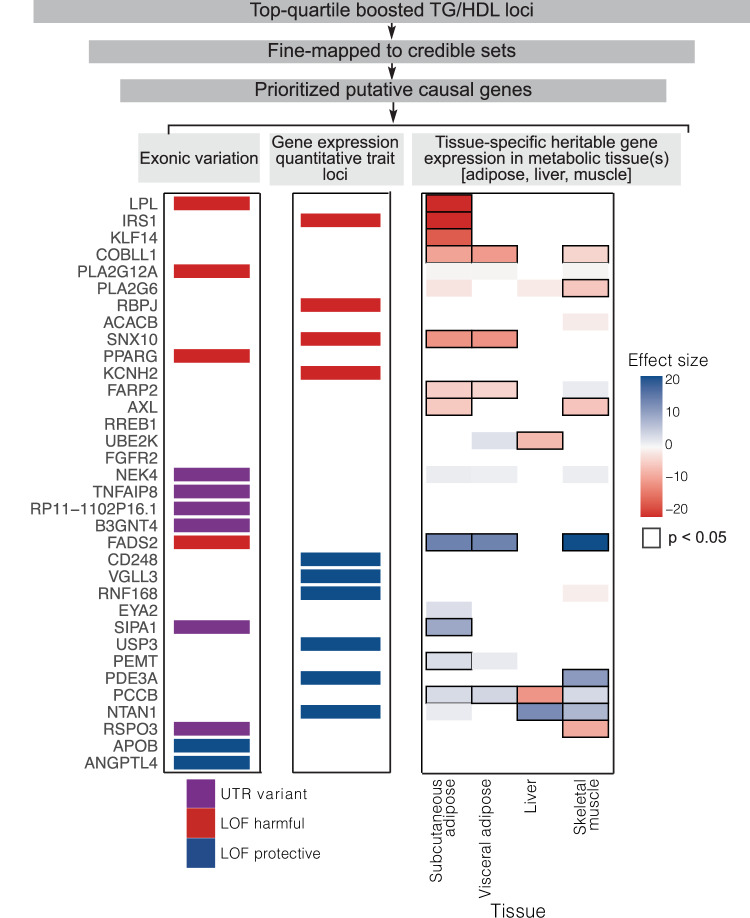
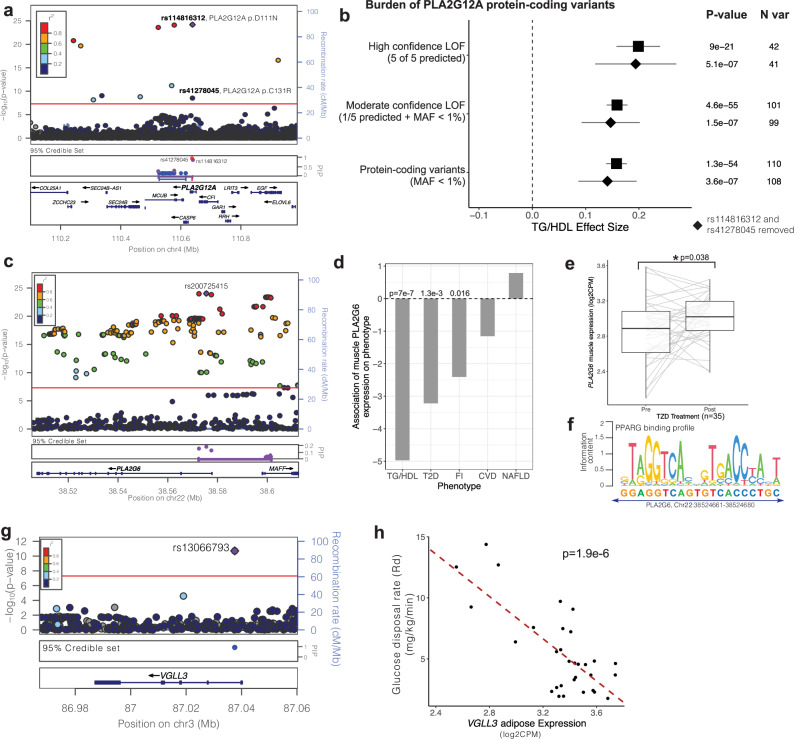
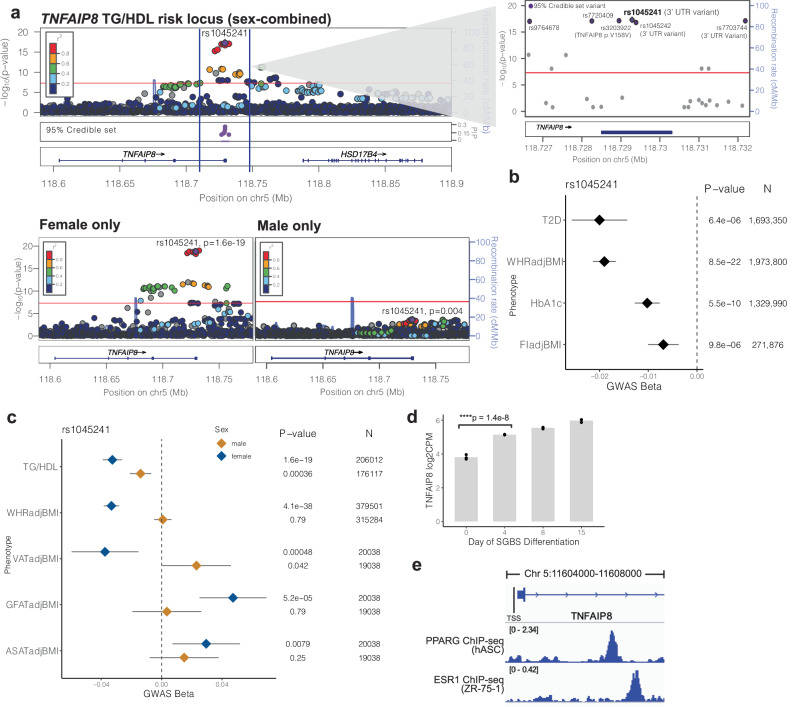
Insulin resistance causes multiple epidemic metabolic diseases, including type 2 diabetes, cardiovascular disease, and fatty liver, but is not routinely measured in epidemiological studies. To discover novel insulin resistance genes in the general population, we conducted genome-wide association studies in 382,129 individuals for triglyceride to HDL-cholesterol ratio (TG/HDL), a surrogate marker of insulin resistance calculable from commonly measured serum lipid profiles. We identified 251 independent loci, of which 62 were more strongly associated with TG/HDL compared to TG or HDL alone, suggesting them as insulin resistance loci. Candidate causal genes at these loci were prioritized by fine mapping with directions-of-effect and tissue specificity annotated through analysis of protein coding and expression quantitative trait variation. Directions-of-effect were corroborated in an independent cohort of individuals with directly measured insulin resistance. We highlight two phospholipase encoding genes, PLA2G12A and PLA2G6, which liberate arachidonic acid and improve insulin sensitivity, and VGLL3, a transcriptional co-factor that increases insulin resistance partially through enhanced adiposity. Finally, we implicate the anti-apoptotic gene TNFAIP8 as a sex-dimorphic insulin resistance factor, which acts by increasing visceral adiposity, specifically in females. In summary, our study identifies several candidate modulators of insulin resistance that have the potential to serve as biomarkers and pharmacological targets.


Conflict of interest statement

P.N. reports research grants from Allelica, Apple, Amgen, Boston Scientific, Genentech/Roche, and Novartis, personal fees from Allelica, Apple, AstraZeneca, Blackstone Life Sciences, Creative Education Concepts, CRISPR Therapeutics, Eli Lilly & Co, Foresite Labs, Genentech/Roche, GV, HeartFlow, Magnet Biomedicine, and Novartis, scientific advisory board membership of Esperion Therapeutics, Preciseli, and TenSixteen Bio, scientific co-founder of TenSixteen Bio, equity in MyOme, Preciseli, and TenSixteen Bio, and spousal employment at Vertex Pharmaceuticals, all unrelated to the present work. The remaining authors declare no competing interests.

Figures

Fig. 1
Fig. 1. GWAS for TG/HDL in 382,129 UK Biobank participants identifies 251 associated loci.
a Genetic architecture of 251 TG/HDL associated loci identified in the UK Biobank (n = 382,129 participants). Shown are the effect sizes of the lead SNPs plotted according to minor allele frequency. Previously identified lipid and insulin resistance (IR) loci are colored orange and red, respectively. Loci with sex-dimorphic association signals are highlighted in blue (n = 17/251). b Genetic correlations of TG/HDL with other surrogate measures of insulin resistance: fasting insulin (FI), fasting glucose (FG), waist-hip ratio (WHR), and metabolic diseases: non-alcoholic fatty liver disease (NAFLD), type 2 diabetes (T2D), and cardiovascular disease (CVD). LD Score regression was used to estimate the p-values and the coefficients of genetic correlation. Color intensity represents the magnitude of the coefficient of genetic correlation, and statistical significance is indicated in the following bins: ****p < 1e-20, ***p < 1e-5, **p < 0.001, *p < 0.05. TG/HDL shows a strong positive genetic correlation with surrogate markers of insulin resistance and metabolic diseases.
Fig. 2
Fig. 2. Prioritizing “boosted” TG/HDL associations to identify insulin resistance loci.
a Cumulative distribution plot of 251 TG/HDL loci according to TG/HDL Boost score. Boost scores greater than 0 signify a stronger association with TG/HDL than TG or HDL alone. Boost scores less than 0 signify the opposite. Among the 251 TG/HDL loci, 109 (43%) have a boost score > 0 (dotted red line). Notable lipid regulation genes (TG:ANGPTL3, HDL:CETP) have highly negative boost scores, whereas known insulin resistance genes show positive boost scores. b Upset plot showing intersection of the 251 identified TG/HDL loci with previous GWAS for surrogate insulin resistance markers and metabolic diseases: fasting insulin (FI), HOMA-IR, coronary artery disease (CVD), type 2 diabetes (T2D), waist-hip ratio (WHR). (Left) Total number of loci that overlap from each study with the 251 TG/HDL loci. (Top) Number of loci within each intersecting group of studies denoted by black circles with selected known insulin resistance loci labeled above. The proportion of each bar comprised of loci with top-quartile boost scores (>1.5) is highlighted in red. For example, TG/HDL, T2D, and FI share 2 loci, GCKR and QKI, in common.
Fig. 3
Fig. 3. Causal gene identification and integrative genomics to infer direction-of-effect of “boosted” TG/HDL loci.
Overview of the gene prioritization strategy for 251 TG/HDL associated loci. The top quartile of TG/HDL boosted loci (n = 62) was selected for fine mapping to obtain 95% credible sets of causal SNPs (n = 57). Of the loci with at least one causal variant identified from fine-mapping (n = 50), causal genes were assigned by incorporating genomic and functional annotations, including exonic variation and expression quantitative trait loci (eQTLs). Direction-of-effect on insulin resistance and tissue specificity of causal genes was assigned by examination of the following gene level evidence: (left) causal variants in exons were annotated as UTR (untranslated region; purple) or protein-coding with loss-of-function (LOF harmful: LOF increases TG/HDL (red); LOF protective: LOF decreases TG/HDL (blue)). (Middle) Causal variants that were eQTLs are assigned as LOF harmful or LOF protective if decreasing expression increases (red) or decreases TG/HDL (blue). (Right) Association of tissue-specific predicted gene expression with TG/HDL in the UK Biobank. All statistics were derived using a weighted linear regression model. Direction and magnitude of effect are represented by color, with positive and negative associations of gene expression with TG/HDL shown as blue and red, respectively, and darker shades demonstrating stronger effect sizes. Significant associations are outlined in black.
Fig. 4
Fig. 4. Evaluation of TG/HDL-associated loci nominates PLA2G12A, PLA2G6, and VGLL3 as novel insulin resistance genes.
a LocusZoom plot of the PLA2G12A TG/HDL locus. The purple diamond represents the lead SNP, and color represents the linkage disequilibrium between each variant with the lead SNP. The PLA2G12A locus contains three 95% credible sets (depicted as red, purple, blue), with the top two causal SNPs rs114816312 (PIP = 0.7) and rs41278045 (PIP = 1) encoding PLA2G12A missense variants. b PLA2G12A loss-of-function (LOF) burden tests in the UK Biobank exome sequenced individuals with increasing confidence (stringency) to define LOF variants. High confidence LOF variants were called deleterious by 5 out of 5 bioinformatics prediction tools (see “Methods”), Moderate confidence LOF variants were those called deleterious by at least 1 bioinformatic prediction tool and had minor allele frequency (MAF) < 1%. Standard burden test results are indicated by squares, and diamonds represent sensitivity analyses removing the top causal variants rs41278045 and rs114816312. 95% confidence intervals (±1.96*standard error) are shown as whiskers. P-values (linear ridge regression models) and number of variants for each analysis are listed. c LocusZoom plot and 95% credible set for the PLA2G6 TG/HDL locus. d Associations of predicted muscle PLA2G6 expression on TG/HDL, type 2 diabetes (T2D), fasting insulin (FI), coronary artery disease (CVD), and non-alcoholic fatty liver disease (NAFLD) (Bayesian sparse linear mixed model). e Upregulation of skeletal muscle PLA2G6 upon TZD treatment in 35 biopsied clinical study participants (fold-change = 1.11, *p = 0.038; linear mixed model). For each boxplot, the middle line in the box indicates the median, the box boundaries represent the 25th and 75th percentiles, and the whiskers are the 5th and 95th percentiles. f PPARG consensus motif overlaid over a high-scoring matching sequence 2231 bp 5’ of the PLA2G6 transcription start site. g LocusZoom plot and 95% credible set for the VGLL3 TG/HDL locus. h Association of adipose tissue VGLL3 expression with glucose disposal rate (Rd) measured by hyperinsulinemic-euglycemic clamp among 31 biopsied participants (b = −8.7, p = 1.9e-6; linear model).
Fig. 5
Fig. 5. TNFAIP8 increases insulin resistance through the alteration of adipose tissue depots in a female-specific manner.
WHR waist-hip ratio, ASAT abdominal subcutaneous adipose, VAT visceral adipose, GFAT gluteofemoral adipose, T2D type 2 diabetes, FI fasting insulin, TG triglycerides, HDL HDL cholesterol, GGT gamma glutamyl transferase, HbA1c glycated hemoglobin, ApoA apolipoprotein A. a (top) LocusZoom plot of the TG/HDL associated locus containing TNFAIP8 from the sex-combined GWAS. The lead SNP (rs1045241, shown as purple diamond) and GWAS p-value (whole-genome regression model) are labeled, and color represents the LD (r2) between each variant with the lead SNP. (Inset panel) Zoom in of the 95% credible set region consisting of 6 SNPs (purple). (Bottom) LocusZoom plots of the TNFAIP8 TG/HDL locus from the sex-stratified GWAS. The association is only significant in females. b Association of TNFAIP8 lead SNP rs1045241 in meta-analyzed metabolic disease/trait association studies. T2D, WHR, FI and HbA1c are significantly decreased by the TG/HDL lowering effect allele. Effect estimates (beta) and 95% confidence intervals are plotted as diamonds and whiskers, along with association p-values (fixed-effect meta-analysis) and sample sizes. c Sex-stratified associations of rs1045241 with metabolic phenotypes. Effect estimates (beta) and 95% confidence intervals are plotted as diamonds and whiskers, and shown for female (blue) and male (orange) stratified GWAS, along with association p-values (linear mixed model) and sample sizes. The TG/HDL lowering effect allele decreases VAT and increases GFAT and ASAT in a female-specific manner. d Upregulation of TNFAIP8 expression in human pre-adipocytes during in vitro differentiation. Linear mixed model was used to obtain the p-value; n = 3 biological replicates per time point. e Gene model of TNFAIP8 highlighting the transcriptional start site (TSS) and first intron (top). (Second track) PPARG ChIP-seq profiling in human adipocytes (human adipose stem cells, hASC). (Bottom) ESR1 ChIP-seq profiling in human breast cell line ZR-75-1.

References

    1. Orgel, E. & Mittelman, S. D. The links between insulin resistance, diabetes, and cancer. Curr. Diab. Rep.13, 213–222 (2013). 10.1007/s11892-012-0356-6 - DOI - PMC - PubMed
    1. Reaven, G. Insulin resistance and coronary heart disease in nondiabetic individuals. Arterioscler. Thromb. Vasc. Biol.32, 1754–1759 (2012). 10.1161/ATVBAHA.111.241885 - DOI - PubMed
    1. Brown, A. E. & Walker, M. Genetics of insulin resistance and the metabolic syndrome. Curr. Cardiol. Rep.18, 75 (2016). 10.1007/s11886-016-0755-4 - DOI - PMC - PubMed
    1. Rasmussen-Torvik, L. J. et al. Heritability and genetic correlations of insulin sensitivity measured by the euglycaemic clamp. Diabet. Med.24, 1286–1289 (2007). 10.1111/j.1464-5491.2007.02271.x - DOI - PubMed
    1. Guo, X. et al. Insulin clearance: confirmation as a highly heritable trait, and genome-wide linkage analysis. Diabetologia55, 2183–2192 (2012). 10.1007/s00125-012-2577-2 - DOI - PMC - PubMed

Publication types

Associated data