. 2024 Sep 14;15(1):8054.
doi: 10.1038/s41467-024-52470-8.

Sequence variants influencing the regulation of serum IgG subclass levels

Affiliations

Sequence variants influencing the regulation of serum IgG subclass levels

Thorunn A Olafsdottir et al. Nat Commun. .

Abstract

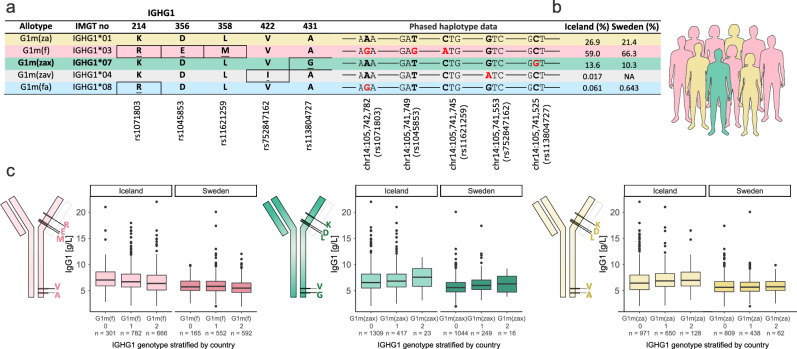
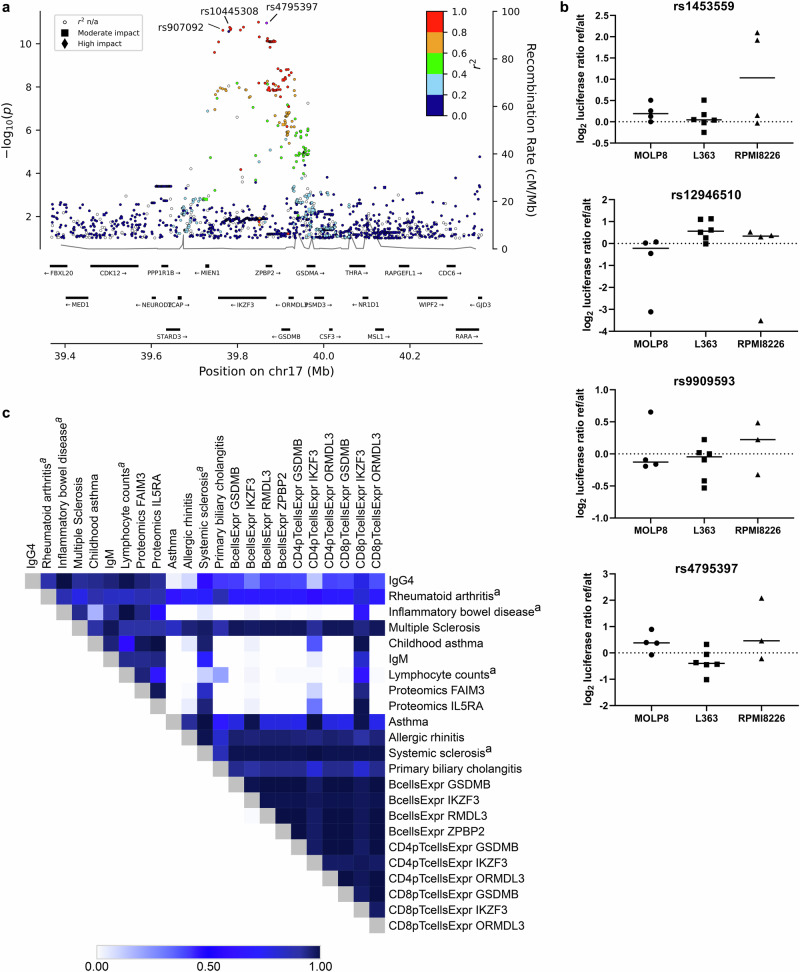
Immunoglobulin G (IgG) is the main isotype of antibody in human blood. IgG consists of four subclasses (IgG1 to IgG4), encoded by separate constant region genes within the Ig heavy chain locus (IGH). Here, we report a genome-wide association study on blood IgG subclass levels. Across 4334 adults and 4571 individuals under 18 years, we discover ten new and identify four known variants at five loci influencing IgG subclass levels. These variants also affect the risk of asthma, autoimmune diseases, and blood traits. Seven variants map to the IGH locus, three to the Fcγ receptor (FCGR) locus, and two to the human leukocyte antigen (HLA) region, affecting the levels of all IgG subclasses. The most significant associations are observed between the G1m (f), G2m(n) and G3m(b*) allotypes, and IgG1, IgG2 and IgG3, respectively. Additionally, we describe selective associations with IgG4 at 16p11.2 (ITGAX) and 17q21.1 (IKZF3, ZPBP2, GSDMB, ORMDL3). Interestingly, the latter coincides with a highly pleiotropic signal where the allele associated with lower IgG4 levels protects against childhood asthma but predisposes to inflammatory bowel disease. Our results provide insight into the regulation of antibody-mediated immunity that can potentially be useful in the development of antibody based therapeutics.


Conflict of interest statement

T.A.O., G.T., L.S., A.J., H.P.E., G.H.H., G.E.T., A.O.A., S.G., K.G., B.V.H., H.H., P.M., G.L.N., S.S., A.S., U.T., P.S., D.F.G., I.J. and K.S. are employees of deCODE Genetics/Amgen, Inc. S.J. is an employee of Alvotech. The remaining authors declare no competing interests.

Figures

Fig. 1
Fig. 1. Frequency of IgG1 allotypes in Iceland and Sweden and association with IgG1 levels.
IgG1 allotypes are defined by one or more missense variants. For each allotype, we include the conventional allotype name, the IMGT numbering, and allotype defining amino acids (AA) at given positions within the IgG1 protein (Eu numbering). Below the respective rsID for the single-nucleotide polymorphism is indicated. Underlined AAs indicate changes from the top allotype, G1m(za). We used phased haplotype data to define the IgG1 allotypes based on the unique presence/absence combination of the missense variants detected in IGHG1 in both Icelanders and Swedes. Single nucleotide polymorphisms (SNPs) corresponding to the underlined AA changes are shown in red. Positions of the missense variants are given in the human reference genome build Hg38 (a). Frequency (%) of the different allotypes found in Icelanders and Swedes (b). Schematic representation of antibody molecules showing the approximate location of the allotype defining AAs. Box plots showing absolute IgG1 serum levels, stratified on allotypes. IgG1 serum levels are plotted for the three most frequent allotypes in Iceland and Sweden (c). Throughout the figure we keep the same color code for the different allotypes, yellow=G1m(za), pink=G1m(f), green=G1m(zax), grey=G1m(zav) and blue=G1m(fa). Single letter codes are used for the AAs, Lysine (K), Aspartic Acid (D), Leucine (L), Valine (V), Alanine (A), Arginine (R), Glutamic Acid (E), Methionine (M), Glycine (G) and Isoleucine (I). In the box plots, the bottom and top of the boxes correspond to the 25th (Q1) and 75th (Q3) percentiles, the line inside the box is the median, and the whiskers are located at Q1 – 1.5 IQR and Q3 + 1.5 IQR (where IQR is the interquartile range, Q1–Q3). c n represents number of carriers where a given IgG1 allotype 0 = non-carrier, 1 = heterozygous carriers and 2 = homozygous carriers.
Fig. 2
Fig. 2. Deletion of the IGHG1 gene associates with increased IgG3 levels in serum.
a A coverage plot showing the rare deletion of the IGHG1 gene that is tagged by the lead variant, rs587597004. Six individuals with different status of the ~28 kb deletion at Hg38-chr14:105734756–105762914 are shown in the figure where each row represents the coverage for an individual. The two individuals on the top are homozygous for the deletion, next two are heterozygous and the bottom two are non-carriers of the deletion (b) Box plots showing absolute serum levels of each IgG subclass, stratified on IGHG1 deletion genotype. c Normalized expression of each IgG subclass gene mRNA in whole blood, stratified on IGHG1 deletion genotype, showing effects consistent with the serum protein levels. d A graph showing the median RNA-sequence coverage of the IGHG1 gene region in whole blood, stratified by the IGHG1 deletion alleles. RNA sequencing data was available for one homozygous deletion carrier, showing no IGHG1 mRNA. In the box plots, the bottom and top of the boxes correspond to the 25th (Q1) and 75th (Q3) percentiles, the line inside the box is the median, and the whiskers are located at Q1 – 1.5 IQR and Q3 + 1.5 IQR (where IQR is the interquartile range, Q1–Q3). b, c n represents number of carriers for the rare deletion where WT wild-type/non-carriers, Het heterozygous carriers and Hom homozygous carriers.
Fig. 3
Fig. 3. Pleiotropic signal at 17q21.1 associates with IgG4 and immune-related traits.
Locus plot showing –log10 P value (calculated using a generalized form of linear regression with two-sided P values) for the top IgG4-associated variant (rs4795397, shown in purple) and all other variants colored by degree of correlation (r2) with the lead variant. Two additional variants are labelled in the figure; rs10445308 is the top eQTL for IKZF3 in plasma cells and rs907092 is the top eQTL for ZPBP2 in plasma cells as well as the top early onset asthma associated variant at the locus (a). Luciferase assays performed for variants identified by ATAC-seq analysis. Graphs showing results for four variants (labelled above each graph) tested in three different plasma cell lines (MOLP8, L363 and RPMI8226). Each data point represents the luciferase activity ratio of ref/alt allele for one experiment with 4 independent experiments performed for MOLP8 and RPMI8226, and 6 experiments for L363. The raw data (renilla-normalized luminescence) was log2 transformed and median-centered. For statistical analysis, we used the Wilcoxon matched-pairs signed rank test with two-sided P values. The test is done pooling all 12 data points (12 experiments) for the three cell lines together rs1453559: P = 0.0134, rs12946510: P = 0.0942, rs9909593: P = 0.51, rs4795397: P = 0.84 (b). Heatmap showing pair-wise co-localization analysis for correlated association signals for immunoglobulins (IgG4, IgM), various inflammatory diseases, proteomics pQTL’s (FAIM3, IL5RA), and eQTL’s in B, CD4pT and CD8pT cells at the 17q21.1 locus. The co-localization is done using the coloc R package (Methods) and the colors show the posterior probability for a one shared genetic signal (PPR4) between the different traits, where white color indicates the lowest probability and dark blue the highest probability (c). Further details on the co-localization analyses can be found in Supplementary Data 19.

Similar articles

Cited by

  • Immune memory reactivation and T cell dynamics following 12-month homologous CoronaVac booster: a longitudinal cohort study.
    Song X, Chen W, Bai S, Lv M, Wang J, Zhang A, Wu J, Zhao W. Song X, et al. Front Immunol. 2025 Jul 17;16:1636629. doi: 10.3389/fimmu.2025.1636629. eCollection 2025. Front Immunol. 2025. PMID: 40746539 Free PMC article.
  • Cohort profile: Copenhagen Hospital Biobank-chronic inflammatory disease-inflammatory bowel disease (CHB-CID:IBD) genetic cohort.
    Darbani B, Brodersen T, Liljensøe A, Sørensen SB, Olsson-Svendsen JB, Buil A, Kamal A, Schork AJ, Poulsen A, Kjerulff BD, Aagaard B, Lund BØ, Rittig CS, Mikkelsen C, Larsen DM, Westergaard D, Rudbeck-Resdal D, Mikkelsen DH, Randers E, Schiødt FV, Hoffmann HJ, Jørgensen IF, Brandslund I, Brodersen JB, von Stemann JH, Bay JT, Nissen J, Sørensen J, Boldsen JK, Dowsett J, Gladov J, Banasik K, Kaspersen KA, Carlsen K, Dinh KM, Kellermann L, Christoffersen LAN, Quinn LJE, Thørner LW, Larsen L, Aamann L, Andersen MR, Didriksen M, Alexandraki MJ, Thomsen MK, Julsgaard M, Nyegaard M, Schwinn M, Topholm-Bruun M, Leite MN, Halling ML, Pedersen N, Bonderup OK, Rohde PD, Ovesen PD, Dessau RB, Saboori S, Holm-Christensen S, Bank S, Mikkelsen S, Hansen TF, Werge T, Qvist N, Sørensen E, Burisch J, Hetland ML, Glintborg B, Erikstrup C, Brunak S, Ullum H, Ostrowski SR, Pedersen OBV, Andersen V. Darbani B, et al. Eur J Epidemiol. 2025 Jun;40(6):721-734. doi: 10.1007/s10654-025-01239-4. Epub 2025 Jun 9. Eur J Epidemiol. 2025. PMID: 40488802 Free PMC article.
  • [Blood vessels as a target organ: from Ormond's disease to immunoglobulin G4-related diseases].
    Krasselt M, Hoyer B. Krasselt M, et al. Inn Med (Heidelb). 2025 Jul;66(7):686-694. doi: 10.1007/s00108-025-01891-8. Epub 2025 Apr 1. Inn Med (Heidelb). 2025. PMID: 40167754 German.

References

    1. Watson, C. T. & Breden, F. The immunoglobulin heavy chain locus: genetic variation, missing data, and implications for human disease. Genes Immun.13, 363–373 (2012). 10.1038/gene.2012.12 - DOI - PubMed
    1. Vidarsson, G., Dekkers, G. & Rispens, T. IgG subclasses and allotypes: from structure to effector functions. Front. Immunol.5, 520 (2014). 10.3389/fimmu.2014.00520 - DOI - PMC - PubMed
    1. Morell, A., Skvaril, F., Steinberg, A. G., Van Loghem, E. & Terry, W. D. Correlations between the concentrations of the four sub-classes of IgG and Gm allotypes in normal human sera. J. Immunol.108, 195–206 (1972). 10.4049/jimmunol.108.1.195 - DOI - PubMed
    1. Sarvas, H., Rautonen, N. & Makela, O. Allotype-associated differences in concentrations of human IgG subclasses. J. Clin. Immunol.11, 39–45 (1991). 10.1007/BF00918793 - DOI - PubMed
    1. Seppala, I. J., Sarvas, H. & Makela, O. Low concentrations of Gm allotypic subsets G3 mg and G1 mf in homozygotes and heterozygotes. J. Immunol.151, 2529–2537 (1993). 10.4049/jimmunol.151.5.2529 - DOI - PubMed

Publication types

MeSH terms

Associated data