. 2024 Sep 14;15(1):8070.
doi: 10.1038/s41467-024-52375-6.

Enhancer-promoter hubs organize transcriptional networks promoting oncogenesis and drug resistance

Affiliations

Enhancer-promoter hubs organize transcriptional networks promoting oncogenesis and drug resistance

Brent S Perlman et al. Nat Commun. .

Abstract

Recent advances in high-resolution mapping of spatial interactions among regulatory elements support the existence of complex topological assemblies of enhancers and promoters known as enhancer-promoter hubs or cliques. Yet, organization principles of these multi-interacting enhancer-promoter hubs and their potential role in regulating gene expression in cancer remain unclear. Here, we systematically identify enhancer-promoter hubs in breast cancer, lymphoma, and leukemia. We find that highly interacting enhancer-promoter hubs form at key oncogenes and lineage-associated transcription factors potentially promoting oncogenesis of these diverse cancer types. Genomic and optical mapping of interactions among enhancer and promoter elements further show that topological alterations in hubs coincide with transcriptional changes underlying acquired resistance to targeted therapy in T cell leukemia and B cell lymphoma. Together, our findings suggest that enhancer-promoter hubs are dynamic and heterogeneous topological assemblies with the potential to control gene expression circuits promoting oncogenesis and drug resistance.


Conflict of interest statement

The authors declare no competing interests.

Figures

Fig. 1
Fig. 1. Enhancer-promoter hubs are systematically identified by divisive hierarchical spectral clustering of an undirected interactivity graph of enhancers and promoters.
a Process of detecting enhancer-promoter hubs from raw chromatin conformation capture data. First, the interactivity graph of enhancer and promoter elements is created from regulatory element nodes connected by pairwise Hi-C or SMC1 HiChIP spatial interactions. Next, an efficient matrix-free divisive hierarchical spectral clustering algorithm is used to partition the enhancer-promoter interactivity graph into spatial clusters. Clusters are then characterized by their contiguous linear genomic intervals from their most upstream spatially interacting regulatory element to their most downstream spatially interacting regulatory element to form enhancer-promoter hubs. These hubs can be ranked based on their interaction count, enhancer/promoter number, and the expressed genes contained within their linear genomic intervals. Input interaction data depicted is for illustrative purposes only. Created with BioRender.com. b Procedure for identifying differential enhancer-promoter hubs between two conditions based on within-hub total interactivity. Top: enhancer-promoter hubs separately identified in each condition are combined into a union set of hubs based on their linear genomic coordinates. The input interaction data depicted is for illustrative purposes only. Spatial enhancer hubs with markedly differential interactivity are identified based on log2 fold change of interaction count between the two conditions. Bottom: diagram of an illustrative differential hub. Bottom left depicts this hub on the linear genome where Hi-C valid interactions (arcs) connect enhancers and promoters (circle nodes) in condition 1 (upper) and condition 2 (lower). Bottom right illustrates a simplified, potential 3D rendering of this hub in each condition, demonstrating that cells in condition 2 gain more than two-fold interactivity at this locus to form a (differential) spatial hub. Created with BioRender.com.
Fig. 2
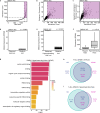
Fig. 2. T-ALL hyperinteracting hubs are markedly transcribed and organize expression of genes encoding transcription factors and cofactors.
a Enhancer-promoter hubs detected from T-ALL DND41 Hi-C data are plotted in ascending order of their total interactivity. The purple region marks hyperinteracting hubs, defined as hubs above the elbow of the total interactivity ranking curve. b Plot of Hi-C interaction count vs. enhancer/promoter element count in each T-ALL DND41 hub with hyperinteracting hubs marked in purple. c Plot of Hi-C interaction count vs. ratio of Hi-C interaction to enhancer/promoter counts in each T-ALL DND41 hub with hyperinteracting hubs marked in purple. d Median gene expression of T-ALL DND41 Hi-C hubs vs. 5000 sets of matched, randomly selected regions (empirical permutation p-value). e Median gene expression of T-ALL DND41 Hi-C hyperinteracting hubs vs. 10,000 sets of matched, randomly selected regions (empirical permutation p-value). f Box-and-whisker plots comparing transcription levels of T-ALL DND41 Hi-C regular (n = 1219) and hyperinteracting (n = 158) hubs. Box-and-whisker plots: center line, median; box limits, upper (75th) and lower (25th) percentiles; whiskers, 1.53 interquartile range. P-value: two-tailed Wilcoxon rank sum test. g Molecular function GO enrichment analysis of DND41 SMC1 HiChIP hyperinteracting hubs. P-value: Fisher’s exact test. h Overlap of T-ALL DND41 hubs identified from Hi-C and SMC1 HiChIP data. Percentages and counts of overlapping and unique hubs are shown separately for Hi-C and SMC1 HiChIP. i Overlap of T-ALL DND41 hyperinteracting hubs identified from Hi-C and SMC1 HiChIP data. Percentages and counts of overlapping and unique hyperinteracting hubs are shown separately for Hi-C and SMC1 HiChIP.
Fig. 3
Fig. 3. MCL hyperinteracting hubs are markedly transcribed and organize expression of genes encoding transcription factors and cofactors.
a Enhancer-promoter hubs detected from MCL Rec-1 Hi-C data are plotted in ascending order of their total interactivity. The purple region marks hyperinteracting hubs, defined as hubs above the elbow of the total interactivity ranking curve. b Plot of Hi-C interaction count vs. enhancer/promoter element count in each MCL Rec-1 hub with hyperinteracting hubs marked in purple. c Plot of Hi-C interaction count vs. ratio of Hi-C interaction to enhancer/promoter counts in each MCL Rec-1 hub with hyperinteracting hubs marked in purple. d Median gene expression of MCL Rec-1 Hi-C hubs vs. 5000 sets of matched, randomly selected regions (empirical permutation p-value). e Median gene expression of MCL Rec-1 Hi-C hyperinteracting hubs vs. 10,000 sets of matched, randomly selected regions (empirical permutation p-value). f Box-and-whisker plots comparing transcription levels of MCL Rec-1 Hi-C regular (n = 1091) and hyperinteracting (n = 41) hubs. Box-and-whisker plots: center line, median; box limits, upper (75th) and lower (25th) percentiles; whiskers, 1.53 interquartile range. P-value: two-tailed Wilcoxon rank sum test. g Molecular function GO enrichment analysis of MCL Rec-1 SMC1 HiChIP hyperinteracting hubs. P-value: hypergeometric test. h Overlap of MCL Rec-1 hubs identified from Hi-C and SMC1 HiChIP data. Percentages and counts of overlapping and unique hubs are shown separately for Hi-C and SMC1 HiChIP. i Overlap of MCL Rec-1 hyperinteracting hubs identified from Hi-C and SMC1 HiChIP data. Percentages and counts of overlapping and unique hyperinteracting hubs are shown separately for Hi-C and SMC1 HiChIP.
Fig. 4
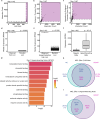
Fig. 4. TNBC hyperinteracting hubs are markedly transcribed and organize expression of genes encoding transcription factors and cofactors.
a Enhancer-promoter hubs detected from TNBC MB157 SMC1 HiChIP data are plotted in ascending order of their total interactivity. The purple region marks hyperinteracting hubs, defined as hubs above the elbow of the total interactivity ranking curve. b Plot of SMC1 HiChIP interaction count vs. enhancer/promoter element count in each TNBC MB157 hub with hyperinteracting hubs marked in purple. c Plot of SMC1 HiChIP interaction count vs. ratio of interaction to enhancer/promoter counts in each TNBC MB157 enhancer-promoter hub with hyperinteracting hubs marked in purple. d Median gene expression of TNBC MB157 SMC1 HiChIP hubs vs. 5000 sets of matched, randomly selected regions (empirical permutation p-value). e Median gene expression of TNBC MB157 SMC1 HiChIP hyperinteracting hubs vs. 10,000 sets of matched, randomly selected regions (empirical permutation p-value). f Box-and-whisker plots comparing transcription levels of TNBC MB157 SMC1 HiChIP regular (n = 752) and hyperinteracting (n = 54) hubs. Box-and-whisker plots: center line, median; box limits, upper (75th) and lower (25th) percentiles; whiskers, 1.53 interquartile range. P-value: two-tailed Wilcoxon rank sum test. g Molecular function GO enrichment analysis of TNBC MB157 SMC1 HiChIP hyperinteracting hubs. P-value: hypergeometric test. h,i H3K27ac ChIP-seq, RNA-seq, and SMC1 HiChIP interactions surrounding gray box-marked SOX9 markedly differ between TNBC (h) and T-ALL/MCL (i). Bottom tracks indicate the Ensembl gene position.
Fig. 5
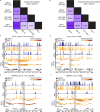
Fig. 5. Hyperinteracting hubs are more lineage associated compared to regular hubs in T-ALL, MCL, and TNBC.
a Matrix of pairwise SMC1 HiChIP enhancer-promoter hub similarity across T-ALL, MCL, and TNBC cells. Total hub count for each cell line is listed on the left. b Matrix of pairwise SMC1 HiChIP hyperinteracting hub similarity across T-ALL, MCL, and TNBC cells. Total hyperinteracting hub count for each cell line is listed on the left. c, d Gray box-marked KAT5 forms a hyperinteracting enhancer-promoter hub with SMC1 HiChIP arcs connecting active regulatory elements and genes marked with H3K27ac ChIP-seq and RNA-seq, respectively, in T-ALL DND41 and MCL Rec-1 (c) but not TNBC MB157 and HCC1599 (d). Bottom tracks indicate Ensembl gene position. e, f Gray box-marked CEBPB forms a hyperinteracting enhancer-promoter hub with SMC1 HiChIP arcs connecting active regulatory elements and genes marked with H3K27ac ChIP-seq and RNA-seq, respectively, in TNBC MB157 and HCC1599 (f) but not T-ALL DND41 and MCL Rec-1 (e). Bottom tracks indicate Ensembl gene position.
Fig. 6
Fig. 6. Loss of IKZF2 hyperinteracting hub coincides with decrease in chromatin activity, gene expression, and architectural stripe in GSI-resistant T-ALL.
a Scatter plot showing log2 fold change of hub interactivity in GSI-resistant DND41 vs. hub interaction counts in GSI-sensitive cells. Dotted lines mark hubs with ≥ 2-fold decrease (“less interacting in GSI resistance”) or increase (“more interacting in GSI resistance”) in interaction counts in GSI-resistant vs. GSI-sensitive DND41 cells. Selected hubs are labeled. b Box-and-whisker plots comparing ATAC-seq (left), H3K27ac ChIP-seq (center), and RNA-seq (right) in hubs that lost interactivity in GSI-resistant cells. Box-and-whisker plots: center line, median; box limits, upper (75th) and lower (25th) percentiles; whiskers, 1.53 interquartile range (n = 118). P-value: two-tailed Wilcoxon rank sum test. c Box-and-whisker plots comparing ATAC-seq (left), H3K27ac ChIP-seq (center), and RNA-seq (right) in hubs that gained interactivity in GSI-resistant cells. Box-and-whisker plots: center line, median; box limits, upper (75th) and lower (25th) percentiles; whiskers, 1.53 interquartile range (n = 99). P-value: two-tailed Wilcoxon rank sum test. d Concordant changes in ATAC-seq, H3K27ac ChIP-seq, H3K27me3 CUT&RUN, and Hi-C over the IKZF2 hub between GSI-sensitive and GSI-resistant DND41 cells. Oligopaint DNA FISH probes are marked with pseudo-color magenta (IKZF2 3’), yellow (gray box-marked IKZF2 promoter), and cyan (IKZF2 5’) below the Ensembl gene track. e IKZF2 normalized RNA-seq reads in GSI-sensitive and GSI-resistant DND41 cells. Each dot represents a biological replicate (n = 3). P-value: two-sided t-test; error bars: ± SEM. f Center and right: cumulative distribution plots of the closest distance between the noted elements in the same cell between 1548 GSI-sensitive and 533 GSI-resistant allelic interactions (Kolmogorov–Smirnov p-value). Inserts show magnified curves at the gray boxes (not drawn to scale). Center: mean (± S.D.) distance in GSI-sensitive and GSI-resistant cells is 0.642 ( ± 0.50) µm, and 0.704 ( ± 0.52) µm, respectively. Right: mean (± S.D.) in GSI-sensitive and GSI-resistant cells is 2.26 ( ± 1.31) µm, and 2.41 ( ± 1.27) µm, respectively. Left: representative cells. g Normalized Hi-C contact maps in GSI-resistant (upper triangle) and GSI-sensitive (lower triangle) DND41 cells at the IKZF2 locus.
Fig. 7
Fig. 7. Genome-wide differential hub screen identifies loci that are aberrantly folded and expressed in ibrutinib-resistant MCL.
a Scatter plot showing log2 fold change of hub interactivity in ibrutinib-resistant Rec-1 vs. hub interaction counts in ibrutinib-sensitive cells. Dotted lines mark enhancer-promoter hubs with ≥ 2-fold decrease (“less interacting in ibrutinib resistance”) or increase (“more interacting in ibrutinib resistance”) in interaction counts in ibrutinib-resistant vs. ibrutinib-sensitive Rec-1 cells. Selected hubs are labeled. b Box-and-whisker plots comparing ATAC-seq (left), H3K27ac ChIP-seq (center), and RNA-seq (right) of hubs with marked loss of interactivity in ibrutinib-resistant cells. Box-and-whisker plots: center line, median; box limits, upper (75th) and lower (25th) percentiles; whiskers, 1.53 interquartile range (n = 34). P-value: two-tailed Wilcoxon rank sum test. c Box-and-whisker plots comparing ATAC-seq (left), H3K27ac ChIP-seq (center), and RNA-seq (right) in hubs that gained interactivity in ibrutinib-resistant cells. Box-and-whisker plots: center line, median; box limits, upper (75th) and lower (25th) percentiles; whiskers, 1.53 interquartile range (n = 125). P-value: two-tailed Wilcoxon rank sum test. d Concordant changes in ATAC-seq, H3K27ac ChIP-seq, RNA-seq, and Hi-C over the PTPRG locus between ibrutinib-sensitive and ibrutinib-resistant Rec-1 cells. e PTPRG normalized RNA-seq reads in ibrutinib-sensitive and ibrutinib-resistant cells. Each dot represents a biological replicate (n = 3). P-value: two-sided t-test; error bars: ± SEM. f Normalized Hi-C contact maps in ibrutinib-resistant (upper triangle) and ibrutinib-sensitive (lower triangle) Rec-1 cells at the PTPRG hub locus. g Coordinated changes in ATAC-seq, H3K27ac ChIP-seq, RNA-seq, and Hi-C over the BCL2L1 locus between ibrutinib-sensitive and ibrutinib-resistant Rec-1 cells. h BCL2L1 normalized RNA-seq reads in ibrutinib-sensitive and ibrutinib-resistant cells. Each dot represents a biological replicate (n = 3). P-value: two-sided t-test; error bars: ± SEM. i Normalized Hi-C contact maps in ibrutinib-resistant (upper triangle) and -sensitive (lower triangle) Rec-1 cells at the BCL2L1 hub.

Update of

Similar articles

Cited by

References

    1. Finn, E. H. et al. Extensive heterogeneity and intrinsic variation in spatial genome organization. Cell176, 1502–1515.e1510 (2019). 10.1016/j.cell.2019.01.020 - DOI - PMC - PubMed
    1. Roukos, V. et al. Spatial dynamics of chromosome translocations in living cells. Science341, 660–664 (2013). 10.1126/science.1237150 - DOI - PMC - PubMed
    1. Zhao, J. & Faryabi, R. B. Spatial promoter-enhancer hubs in cancer: organization, regulation, and function. Trends Cancer, (2023). - PMC - PubMed
    1. Uyehara C. M., Apostolou E. 3D enhancer-promoter interactions and multi-connected hubs: Organizational principles and functional roles. Cell Rep, 112068 (2023). - PMC - PubMed
    1. Suva, M. L., Riggi, N. & Bernstein, B. E. Epigenetic reprogramming in cancer. Science339, 1567–1570 (2013). 10.1126/science.1230184 - DOI - PMC - PubMed

Publication types

MeSH terms

Substances

Associated data