. 2024 Sep 14;15(1):8058.
doi: 10.1038/s41467-024-52489-x.

Biodegradable oxygen-evolving metalloantibiotics for spatiotemporal sono-metalloimmunotherapy against orthopaedic biofilm infections

Affiliations

Biodegradable oxygen-evolving metalloantibiotics for spatiotemporal sono-metalloimmunotherapy against orthopaedic biofilm infections

Zheng Su et al. Nat Commun. .

Abstract

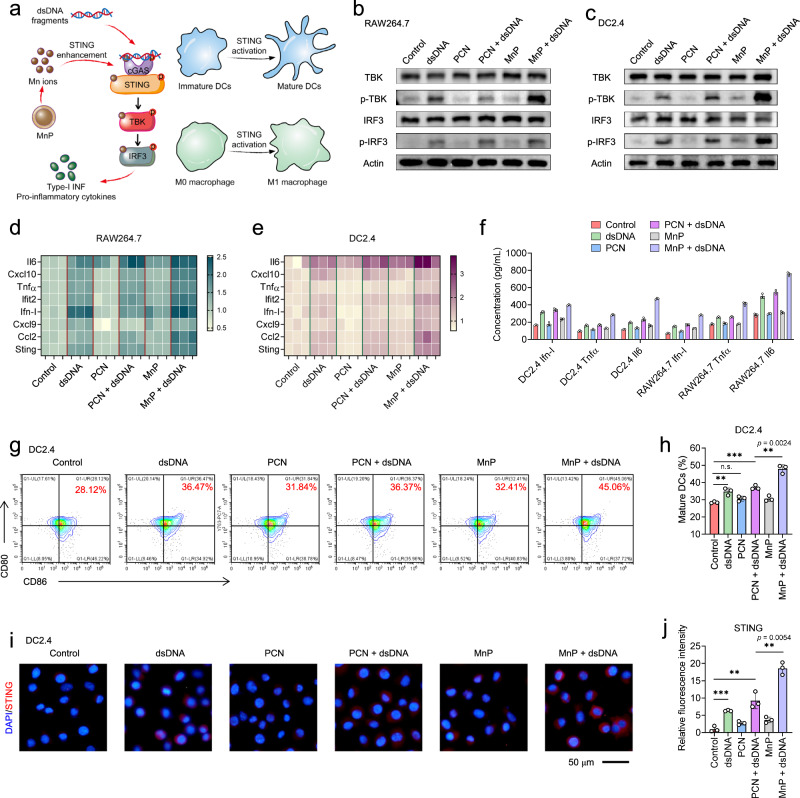
Pathogen-host competition for manganese and intricate immunostimulatory pathways severely attenuates the efficacy of antibacterial immunotherapy against biofilm infections associated with orthopaedic implants. Herein, we introduce a spatiotemporal sono-metalloimmunotherapy (SMIT) strategy aimed at efficient biofilm ablation by custom design of ingenious biomimetic metal-organic framework (PCN-224)-coated MnO2-hydrangea nanoparticles (MnPM) as a metalloantibiotic. Upon reaching the acidic H2O2-enriched biofilm microenvironment, MnPM can convert abundant H2O2 into oxygen, which is conducive to significantly enhancing the efficacy of ultrasound (US)-triggered sonodynamic therapy (SDT), thereby exposing bacteria-associated antigens (BAAs). Moreover, MnPM disrupts bacterial homeostasis, further killing more bacteria. Then, the Mn ions released from the degraded MnO2 can recharge immune cells to enhance the cGAS-STING signaling pathway sensing of BAAs, further boosting the immune response and suppressing biofilm growth via biofilm-specific T cell responses. Following US withdrawal, the sustained oxygenation promotes the survival and migration of fibroblasts, stimulates the expression of angiogenic growth factors and angiogenesis, and neutralizes excessive inflammation. Our findings highlight that MnPM may act as an immune costimulatory metalloantibiotic to regulate the cGAS-STING signaling pathway, presenting a promising alternative to antibiotics for orthopaedic biofilm infection treatment and pro-tissue repair.


Conflict of interest statement

The authors declare the following competing interests: Z.S., C.Z., W.Z., D.X., and X.H. are inventors on a patent application (China Patent No. CN117018025A) based on the technology presented in this manuscript. The others authors declare no competing interests.

Figures

Fig. 1
Fig. 1. Scheme illustrating the mechanism by which MnPM enhances SDT and boosts antibiofilm metalloimmunotherapy.
A spatiotemporal SMIT strategy is proposed for biofilm ablation. Upon injection at the biofilm, MnPM can act as an oxygen self-supplying sonosensitizer, thereby enhancing SDT against recalcitrant implant-related infections. Concurrently, the released Mn ions can sensitize the biofilm to SDT by disrupting intracellular homeostasis, further facilitating biofilm degradation. The innate immune system serves as the primary source of crucial signals required to instigate adaptive immune responses. Consequently, we anticipate these two elements to exhibit significant synergy. Moreover, bacterial fragments (e.g., double-stranded DNA, dsDNA, etc.) as BAAs released from the damaged biofilm can collaborate with Mn ions to initiate effective innate and adaptive antibiofilm immune responses by activating STING to suppress biofilm growth.
Fig. 2
Fig. 2. Preparation and characterization of MnPM.
a TEM image of MnO2-hydrangea nanoparticles. Scale bar, 100 nm. b Particle size distribution of MnO2-hydrangea nanoparticles. c The effect of H2O2 (100 μM) and concentration of MnO2 nanoparticles on oxygen production. d Schematic illustration of the fabrication of MnP for oxygen-enhanced SDT. e TEM images of MnP-1, MnP-2, MnP-3, and MnP nanoparticles. Scale bar, 50 nm. f Hydrodynamic particle size distribution of MnO2, MnP-1, and MnP-3 by DLS. g Particle size distribution of MnP. h Merged image of MnP nanoparticles with elemental mapping of Mn, O, N, and Zr. Scale bar, 50 nm. i N2-adsorption-desorption isotherms of MnO2 and MnP nanoparticles. j TGA analysis curves of MnO2 and MnP nanoparticles. k The fluorescence emission spectra of the SOSG assay of the MnP + H2O2 + US group for singlet oxygen detection. l ROS generation of Control, PCN, and MnP (200 μg/mL) treated with or without 100 μM H2O2 upon US exposure (2 W/cm2, 1 MHz, 50%) for 30 min. n = 3 independent experiments; means ± SDs. m TEM images of the MnO2 degradation process at pH 5.0 with H2O2. Scale bar, 100 nm. n Schematic illustration of the construction of MnPM. o Fluorescence imaging of hybrid membranes of neutrophils and macrophages (green, neutrophil membrane, PKH67; red, macrophage membrane, DiI). Scale bar, 5 μm. p TEM image of MnPM nanoparticles. Scale bar, 50 nm. q HAADF-STEM image and element-mapping images of MnPM nanoparticles. r Western blot analysis of total membrane proteins of MnP, neutrophils, macrophages, neutrophil membranes, macrophage membranes, and MnPM. s Biodistribution of Cy5.5-labled MnP and MnPM in implant-associated biofilm infection mice at 0, 1, 6, and 12 h via in vivo bioluminescence imaging. Source data are provided as a Source Data file.
Fig. 3
Fig. 3. In vitro antibiofilm effect.
a SEM images of E. coli and MRSA biofilms treated with Control, US, PCN, PCN + US, MnP, and MnP + US. Scale bar, 2 μm. b Three-dimensional reconstructions of the fluorescence-labeled E. coli and MRSA biofilms stained with SYTO9 (green, indicating dead and live bacteria) and PI (red, indicating dead bacteria). Scale bar, 100 μm. c Macroscopic E. coli and MRSA biofilm images of the Control, US, PCN, PCN + US, MnP, and MnP + US groups with crystal violet staining. Scale bar, 4 mm. d Biofilm biomass of E. coli and MRSA biofilms after various treatments. n = 3 independent experiments; means ± SDs. n.s., not significant; *p < 0.05, **p < 0.01, ***p < 0.001, and ****p < 0.0001 using two-tailed Student’s t tests. e Typical photos of disrupted bacterial colonies from E. coli and MRSA biofilms in the Control, US, PCN, PCN + US, MnP, and MnP + US groups. Scale bar, 2.5 cm. f Number of CFUs of E. coli and MRSA in six different treatment groups determined by SPM. n = 3 independent experiments; means ± SDs. n.s., not significant; *p < 0.05, **p < 0.01, ***p < 0.001, and ****p < 0.0001 using two-tailed Student’s t tests. g The dsDNA concentration of E. coli and MRSA biofilms in six different treatment groups. n = 3 independent experiments; means ± SDs. n.s., not significant; *p < 0.05, **p < 0.01, ***p < 0.001, and ****p < 0.0001 using two-tailed Student’s t tests. Flow cytometry scatter plots of PI and SYTO9 co-staining of E. coli (h, i) and MRSA (j, k) detached from the biofilms after various treatments with quantitative analysis. n = 3 independent experiments; means ± SDs. n.s., not significant; *p < 0.05, **p < 0.01, ***p < 0.001, and ****p < 0.0001 using two-tailed Student’s t tests. Source data are provided as a Source Data file.
Fig. 4
Fig. 4. In vitro antibiofilm mechanism.
Bacterial transcriptomics analysis. GO term (a) and KEGG enrichment (b) analysis of downregulated genes in bacteria between the Control and MnP + US groups. Heat map analysis of differentially expressed genes about QS system (c), cytosolic membrane integrity (d), antioxidant proteases (e), Mn ion homeostasis (f) between the Control and MnP + US groups. g Relative gene expression of AgrA and AgrB. n = 3 independent experiments; means ± SDs. n.s., not significant; *p < 0.05, **p < 0.01, ***p < 0.001, and ****p < 0.0001 using two-tailed Student’s t tests. h BCA leakage and ONPG test of MRSA biofilm. n = 3 independent experiments; means ± SDs. n.s., not significant; *p < 0.05, **p < 0.01, ***p < 0.001, and ****p < 0.0001 using two-tailed Student’s t tests. i Antioxidant capacity evaluation, including GPx activity, SOD activity, and ROS levels in biofilms. n = 3 independent experiments; means ± SDs. n.s., not significant; *p < 0.05, **p < 0.01, ***p < 0.001, and ****p < 0.0001 using two-tailed Student’s t tests. j TEM image of MRSA treated by MnP + US with quantitative analysis. Scale bar, 500 nm. k Elemental mapping of the Mn ion with quantitative analysis. Scale bar, 100 nm. n = 3 independent experiments; means ± SDs. n.s., not significant; *p < 0.05, **p < 0.01, ***p < 0.001, and ****p < 0.0001 using two-tailed Student’s t tests. l Relative gene expression of MntH, MntABC, and MntE. n = 3 independent experiments; means ± SDs. n.s., not significant; *p < 0.05, **p < 0.01, ***p < 0.001, and ****p < 0.0001 using two-tailed Student’s t tests. m Schematic of Mn ion overabundance. Source data are provided as a Source Data file.
Fig. 5
Fig. 5. In vitro promotion of the cGAS-STING pathway.
a Schematic illustration of the promotion of the cGAS-STING pathway. b, c Western blot of the activation of the cGAS-STING pathway in APCs (RAW264.7 and DC2.4 cells) after different treatments. Actin = 42 kDa, IRF3 and p-IRF3 = 46 kDa, TBK and p-TBK = 84 kDa. Relative gene expression of the cGAS-STING axis in RAW264.7 (d) and DC2.4 (e) cells after different treatments by qPCR analysis. f ELISA detection of Ifn-I, Tnfα, and Il6 in RAW264.7 and DC2.4 cells after different treatments. n = 3 independent experiments; means ± SDs. n.s., not significant; *p < 0.05, **p < 0.01, ***p < 0.001, and ****p < 0.0001 using two-tailed Student’s t tests. g The efficacy of promoting DC maturation in different groups evaluated by flow cytometry in vitro with quantitative analysis (h). n = 3 independent experiments; means ± SDs. n.s., not significant; *p < 0.05, **p < 0.01, ***p < 0.001, and ****p < 0.0001 using two-tailed Student’s t tests. i CLSM images showing STING activation in DCs with quantitative analysis (j), where blue represents cell nuclei and red represents STING. Scale bar, 50 μm. n = 3 independent experiments; means ± SDs. n.s., not significant; *p < 0.05, **p < 0.01, ***p < 0.001, and ****p < 0.0001 using two-tailed Student’s t tests. Source data are provided as a Source Data file.
Fig. 6
Fig. 6. Evaluation of the in vivo immunogenic effect in the implant-associated biofilm infection model.
a Schematic of the implant-associated biofilm infection model and therapeutic procedure of the SMIT strategy. b Average infection area change curves in infected mice after different treatments. Representative photos of the Control and MnPM + US groups on day 14. n = 3; means ± SDs; **p < 0.01 using Two-way ANOVA. c Bacterial CFU counts of residual biofilm on the extracted implants and residual bacteria in the peripheral tissues on day 14. n = 3 independent animals; means ± SDs. n.s., not significant; *p < 0.05, **p < 0.01, ***p < 0.001, and ****p < 0.0001 using two-tailed Student’s t tests. d qPCR analysis of the relative gene expression of the cGAS-STING axis with different treatments. Representative flow cytometry plots of CD4 + T cells (CD4 + ) by gating on CD3 + T cells (e, f), M1-phenotype macrophages (CD80 + CD206-) by gating on CD11b + F4/80+ cells (g, h), and mature DCs (CD80 + CD86 + ) by gating on CD11c+MHC-II+ cells (i, j) in spleens. n = 3 independent animals; means ± SDs. n.s., not significant; *p < 0.05, **p < 0.01, ***p < 0.001, and ****p < 0.0001 using two-tailed Student’s t tests. Source data are provided as a Source Data file.
Fig. 7
Fig. 7. In vivo transcriptomics analysis.
a GO term analysis of upregulated terms after treatment with MnPM + US on day 3. Pink, highlight. b KEGG enrichment of upregulated genes after treatment with MnPM + US on day 3. GSEA of representative immune signaling pathways about NF-kappa B (c), NOD-like receptor (d), cytosolic DNA-sensing (e), IL17 (f), TNF (g) after treatment with MnPM + US on day 3. h GO term analysis of upregulated terms after treatment with MnPM + US on day 10. Pink, highlight. i, KEGG enrichment of upregulated genes after treatment with MnPM + US on day 10. GSEA of representative repair signaling pathways about DNA replication (j), cell cycle (k), ribosome biogenesis in eukaryotes (l), mismatch repair (m), nucleotide excision repair (n) after treatment with MnPM + US on day 10. Source data are provided as a Source Data file.
Fig. 8
Fig. 8. In vitro pro-tissue repair evaluation.
a Schematic of posttreatment with SMIT therapy. Sustained oxygenation from MnP without US accelerated wound healing. b Flow cytometry of CD80 and CD206 expression on macrophage after different treatments. c M2-phenotype macrophage percentage. n = 3 independent experiments; means ± SDs. n.s., not significant; *p < 0.05, **p < 0.01, ***p < 0.001, and ****p < 0.0001 using two-tailed Student’s t tests. d Relative gene expression of RAW264.7 cells after different treatments by qPCR analysis. e ELISA detection of Il10, Vegf, Il6, and Tnfα in RAW264.7 cells after different treatments. n = 3 independent experiments; means ± SDs. n.s., not significant; *p < 0.05, **p < 0.01, ***p < 0.001, and ****p < 0.0001 using two-tailed Student’s t tests. f Scratch assay of EA.hy926 cells cultured in macrophage-conditioned media for 0 and 24 h with quantitative analysis of the migration ratio (g). Scale bar, 200 μm. n = 3 independent experiments; means ± SDs. n.s., not significant; *p < 0.05, **p < 0.01, ***p < 0.001, and ****p < 0.0001 using two-tailed Student’s t tests. h Transwell migration assay of EA.hy926 cells in different groups with quantitative analysis of the number of migrated cells (i). Scale bar, 200 μm. n = 3 independent experiments; means ± SDs. n.s., not significant; *p < 0.05, **p < 0.01, ***p < 0.001, and ****p < 0.0001 using two-tailed Student’s t tests. j Vascular tube formation of EA.hy926 cells cultured in various macrophage-conditioned media on Matrigel for 6 h with quantitative analysis of the number of circles (k). Scale bar, 200 μm. n = 3 independent experiments; means ± SDs. n.s., not significant; *p < 0.05, **p < 0.01, ***p < 0.001, and ****p < 0.0001 using two-tailed Student’s t tests. Source data are provided as a Source Data file.
Fig. 9
Fig. 9. In vivo healing of infected skin wounds.
a Schematic illustration of the experimental animal models of wound MRSA infection to evaluate SMIT and oxygen-mediated tissue repair. b Representative images of wound size changes during 14 days post-wounding. Immunohistochemical analysis. Immunohistochemical staining (c) with quantitative analysis (d) for STING, IL17, and IL23r on day 3. Scale bars, 250 μm. n = 3 independent animals; means ± SDs. n.s., not significant; *p < 0.05, **p < 0.01, ***p < 0.001, and ****p < 0.0001 using two-tailed Student’s t tests. eh Histomorphological analysis via hematoxylin and eosin (H&E), Giemsa, and Masson’s trichrome staining of the peripheral tissues after various treatments with quantitative analysis (fh). Scale bars, 50 μm. n = 3 independent animals; means ± SDs. n.s., not significant; *p < 0.05, **p < 0.01, ***p < 0.001, and ****p < 0.0001 using two-tailed Student’s t tests. i Immunohistochemical staining of CD31. Scale bars, 50 μm. j M2-phenotype macrophages (CD80-CD206 + ) by gating on CD11b + F4/80+ cells. k Immunofluorescence staining of cytokeratin 14 (K14, green) and cytokeratin 19 (K19, red) for the wounds on days 3, 10, and 14. Scale bars, 50 μm. l A scheme illustrating Th17 cell differentiation. m Immunofluorescence staining of IL10 (green) and IL6 (red) for the wounds on days 3 and 10. Scale bars, 50 μm. Source data are provided as a Source Data file.

References

    1. Patel, R. Periprosthetic Joint Infection. New Engl. J. Med.388, 251–262 (2023). 10.1056/NEJMra2203477 - DOI - PubMed
    1. Levy, S. B. & Marshall, B. Antibacterial resistance worldwide: causes, challenges and responses. Nat. Med.10, S122–S129 (2004). 10.1038/nm1145 - DOI - PubMed
    1. Willyard, C. The drug-resistant bacteria that pose the greatest health threats. Nature News543, 15 (2017).10.1038/nature.2017.21550 - DOI - PubMed
    1. Arciola, C. R., Campoccia, D. & Montanaro, L. Implant infections: adhesion, biofilm formation and immune evasion. Nat. Rev. Microbiol.16, 397–409 (2018). 10.1038/s41579-018-0019-y - DOI - PubMed
    1. Flemming, H.-C. et al. Biofilms: an emergent form of bacterial life. Nat. Rev. Microbiol.14, 563–575 (2016). 10.1038/nrmicro.2016.94 - DOI - PubMed

Publication types

Associated data