. 2024 Sep 14;15(1):8069.
doi: 10.1038/s41467-024-52119-6.

Orientia tsutsugamushi Ank5 promotes NLRC5 cytoplasmic retention and degradation to inhibit MHC class I expression

Affiliations

Orientia tsutsugamushi Ank5 promotes NLRC5 cytoplasmic retention and degradation to inhibit MHC class I expression

Haley E Adcox et al. Nat Commun. .

Abstract

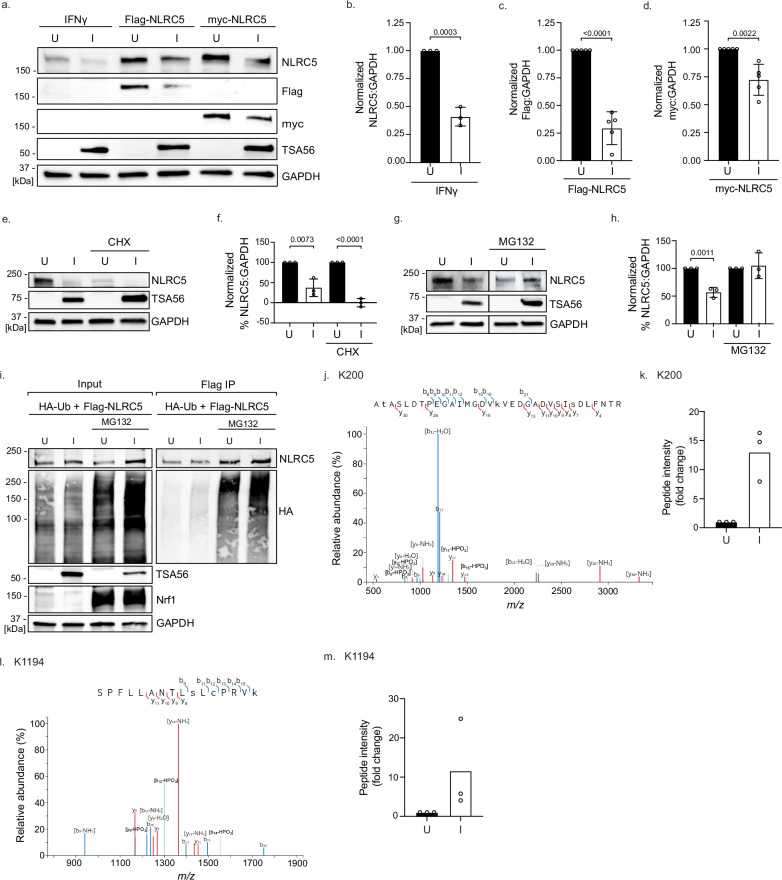
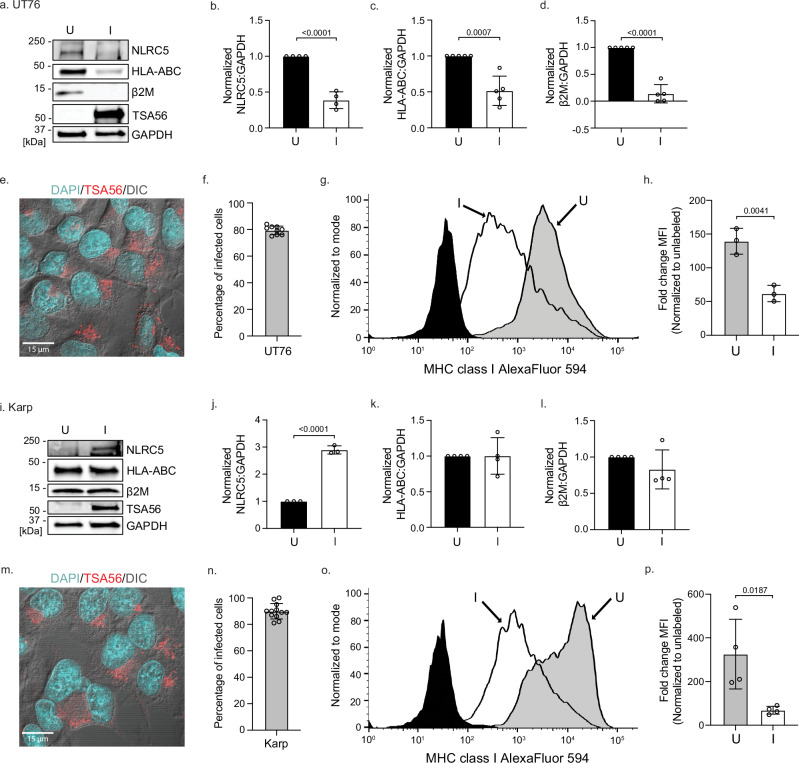
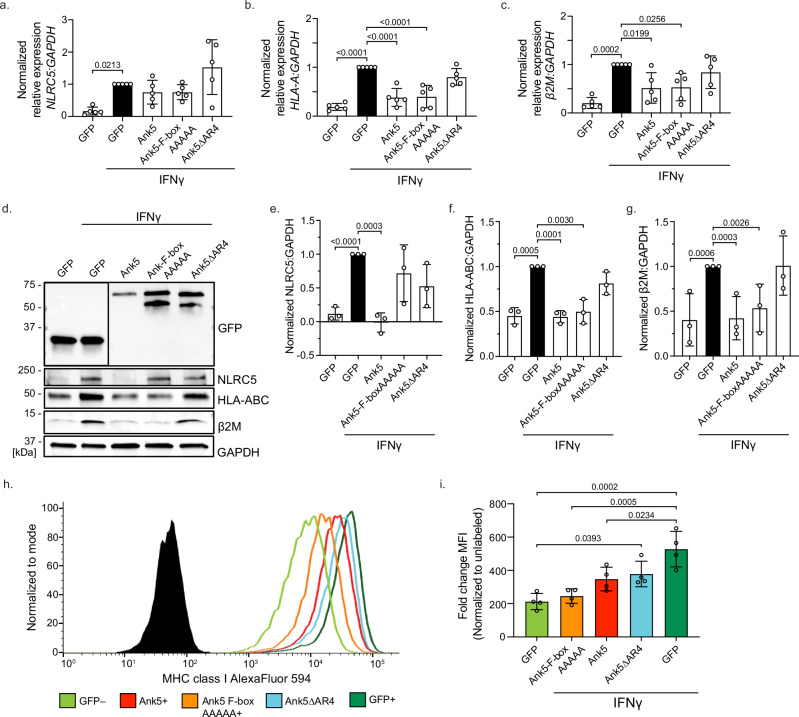
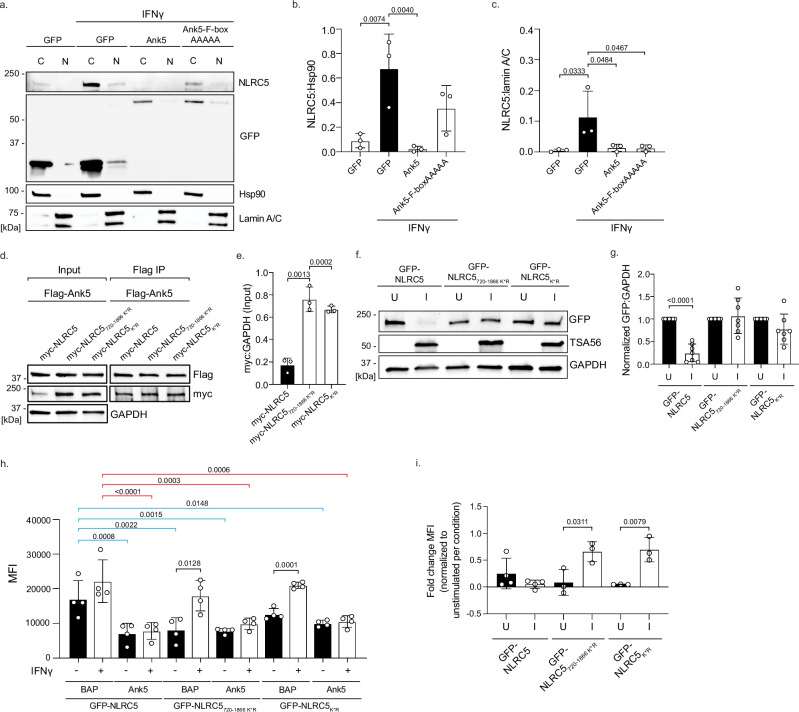
How intracellular bacteria subvert the major histocompatibility complex (MHC) class I pathway is poorly understood. Here, we show that the obligate intracellular bacterium Orientia tsutsugamushi uses its effector protein, Ank5, to inhibit nuclear translocation of the MHC class I gene transactivator, NLRC5, and orchestrate its proteasomal degradation. Ank5 uses a tyrosine in its fourth ankyrin repeat to bind the NLRC5 N-terminus while its F-box directs host SCF complex ubiquitination of NLRC5 in the leucine-rich repeat region that dictates susceptibility to Orientia- and Ank5-mediated degradation. The ability of O. tsutsugamushi strains to degrade NLRC5 correlates with ank5 genomic carriage. Ectopically expressed Ank5 that can bind but not degrade NLRC5 protects the transactivator during Orientia infection. Thus, Ank5 is an immunoevasin that uses its bipartite architecture to rid host cells of NLRC5 and reduce surface MHC class I molecules. This study offers insight into how intracellular pathogens can impair MHC class I expression.


Conflict of interest statement

The authors declare no competing interests.

Figures

Fig. 1
Fig. 1. O. tsutsugamushi promotes ubiquitination and proteasomal degradation of NLRC5.
ad HeLa cells were mock transfected and treated with IFNγ or transfected to express Flag-NLRC5 or myc-NLRC5 and then mock infected [U] or infected with O. tsutsugamushi [I]. a Whole cell lysates were analyzed by immunoblot. bd NLRC5 (b), Flag (c), or myc (d) densitometric signal was divided by corresponding GAPDH signal and normalized to uninfected cells (black bars). (n = 3 (b) or 5 (c, d) independent experiments). eh HeLa cells were mock infected [U] or infected with O. tsutsugamushi [I] and treated with cycloheximide (CHX) (e, f) or MG132 (g and h) for 16 h prior to collection. (e and g) Whole cell lysates were analyzed by immunoblot. f, h NLRC5 densitometric signal was divided by corresponding GAPDH densitometric signal, normalized to uninfected cells, and multiplied by 100 (black bars) (n = 3 independent experiments). i HeLa cells were transfected to co-express Flag-NLRC5 and HA-Ub, mock infected [U] or infected with O. tsutsugamushi [I] and treated with MG132 for 24 h prior to collection. Input lysates and Flag IP complexes were analyzed by immunoblot (n = 3 independent experiments). jm HeLa cells were transfected to express Flag-NLRC5, mock infected [U] or infected with O. tsutsugamushi [I] and treated with MG132 for 24 h prior to collection. Flag-NLRC5 was immunoprecipitated and the eluted complex was analyzed by mass spectrometry. j, l Fragmentation spectra of the post-translationally modified peptides K200 [184ATASLDTPEGAIMGDVKVEDGADVSISDLFNTR216] (j) and K1194 [1179SPFLLANTLSLCPRVK1194] (l). Spectra-matched b- (blue) and y-ion (red) fragments are displayed and summarized by the trypsinized peptide sequence inset above. k, m Peptide intensity presented as fold change (n = 3 independent experiments). Vertical lines between bands indicate where the blot was cropped or imaged separately. Data are means ± SD. Unpaired two-tailed t-test was used for data analysis (bd, f, h). Source data are provided as Source Data file.
Fig. 2
Fig. 2. O. tsutsugamushi UT76, but not Karp, decreases cellular levels of NLRC5 and MHC class I components, yet both decrease surface MHC class I levels.
HeLa cells were mock infected [U] or infected for 72–96 h with O. tsutsugamushi strain UT76 [I] (ah) or Karp [I] (ip) and treated with IFNγ. a, i Whole cell lysates were analyzed by immunoblot. bd, ji The densitometric signal of NLRC5 (b, j), HLA-ABC (c, k), or β2 M (d, l) was divided by corresponding GAPDH densitometric signal and normalized to uninfected cells (black bars) (n = 3 (j), 4 (b, k, l), or 5 (c, d) independent experiments). e, m Infected HeLa cells were fixed, immunolabelled for TSA56 (red), stained with DAPI, and visualized using LSCM and differential interference contrast microscopy (DIC). f, n The percentage of infected cells was quantified. g, h, o, p Surface levels of MHC class I from uninfected and infected cells were analyzed by flow cytometry. g, o Representative histograms of MHC class I levels normalized to mode. Unlabeled (black) samples served as the control. h, p The mean fluorescence intensity of each sample was divided by that of its unlabeled control per replicate (n = 3–4 independent experiments). Data are means ± SD. Unpaired two-tailed t-test was used for data analysis (bd, h, jl, p). Source data are provided as Source Data file.
Fig. 3
Fig. 3. Ank5 decreases NLRC5, cellular MHC class I, and MHC class I surface levels.
a, b HeLa cells were mock transfected or transfected to express Flag-tagged Ank5 or Ank9 and treated with vehicle [-] or IFNγ [+]. a Inputs and Flag IP complexes were analyzed by immunoblot. b Densitometric quantification of NLRC5:GAPDH signal from input blots (n = 4 independent experiments). Indicators of significance between IFNγ-treated are blue. cf HeLa cells were transfected to express indicated proteins, treated with IFNγ, and sorted on GFP positivity. c Whole cell lysates were analyzed by immunoblot. df Densitometric signal of NLRC5 (d), HLA-ABC (e), or β2 M (f) was divided by corresponding GAPDH signal and normalized to GFP-expressing IFNγ treated cells (black bars) (n = 3 independent experiments). g, h HeLa cells were mock transfected or transfected to co-express Flag-Ank5 or Flag-Ank9 with myc-NLRC5. g Input lysates and Flag IP complexes were analyzed by immunoblot. h Densitometric quantification of the NLRC5:GAPDH ratio from input blots normalized to mock samples (black bar) (n = 3 independent experiments). in HeLa (i, j, m, n) or EA.hy926 (k, l) cells were mock transfected or transfected to express indicated proteins and treated with IFNγ. (i, k) Whole cell lysates were analyzed by immunoblot. j, l Densitometric quantification of the NLRC5:GAPDH signal from input blots normalized to mock transfected cells treated with IFNγ (black bar, HeLa; red bar, EA.hy926) (n = 3 independent experiments). m, n MHC class I surface levels on GFP-positive cells were analyzed by flow cytometry. m Representative histograms of MHC class I levels normalized to mode. Unlabeled (black) samples were the control. [–] denotes vehicle control and [+] denotes IFNγ addition. n The mean fluorescence intensity of each sample was divided by that of its unlabeled control per replicate (n = 7 independent experiments). Data are means ± SD. Unpaired two-tailed t-test (b, df, h, j, l) and One-way ANOVA with Tukey’s post hoc test (n) were used for data analysis. Source data are provided as Source Data file.
Fig. 4
Fig. 4. Ank5 directs ubiquitination and proteasomal degradation of NLRC5 in an F-box-dependent manner.
a, b HeLa cells were transfected to express myc-NLRC5 alone or together with Flag-Ank5 and treated with vehicle [−] or MG132 [+]. a Both input lysates and Flag IP complexes were analyzed by immunoblot. b Densitometric signal of immunoprecipitated NLRC5 divided by that of the corresponding Flag-Ank5 signal (n = 3 independent experiments). c, d HeLa cells were transfected with nontargeting (siNT) or Skp1-targeting (siSkp1) siRNA. The cells were then transfected to co-express myc-NLRC5 and either Flag-Ank5 or Flag-Ank5∆F-box. c Whole cell lysates were analyzed by immunoblot. (d) Densitometric quantification of the NLRC5:GAPDH signal ratio (n = 5 independent experiments). e, f HeLa cells were transfected to co-express myc-NLRC5 with indicated Flag-Ank5 proteins. e Whole cell lysates were analyzed by immunoblot. Vertical lines between bands indicate where the blot was cropped or imaged separately. f Densitometric quantification of NLRC5:GAPDH signal. (n = 6 independent experiments). g, h HeLa cells were transfected to co-express Flag-NLRC5 and either GFP-Ank5 or GFP-Ank5-F-boxAAAAA, treated with MG132, and cell sorted on GFP-positivity. Flag-NLRC5 was immunoprecipitated and the eluted complexes were analyzed by mass spectrometry. g Fragmentation spectra of the post-translationally modified K1194 [1179SPFLLANTLSLCPRVK1194] peptide. Spectra-matched b- (blue) and y-ion (red) fragments are displayed and summarized by the trypsinized peptide sequence inset above. h Peptide intensity presented as fold change (n = 2 independent experiments). Data are means ± SD. Unpaired two-tailed t-test (b, d, f) was used for data analysis. Source data are provided as Source Data file.
Fig. 5
Fig. 5. Ank5 AR4 is critical for binding NLRC5, the NLRC5 LRR is essential for Ank5-mediated degradation, and Ank5-F-boxAAAAA competitively antagonizes O. tsutsugamushi mediated NLRC5 degradation.
ad HeLa cells were transfected to co-express myc-NLRC5 and indicated Flag-tagged Ank5 proteins. a, c Input lysates and Flag IP complexes were analyzed by immunoblot. b, d Densitometric signal of immunoprecipitated NLRC5 was divided by the corresponding Flag-Ank5 protein signal and multiplied by 100 to determine percent interaction (n = 3 independent experiments). e, f Schematic of wt NLRC5 (e) and isoform 3 (f). Amino acid positions at the beginning of each domain are indicated. gj HeLa cells were transfected to co-express myc-tagged wt NLRC5 or isoform 3 with Flag-tagged Ank5 or Ank5-F-boxAAAAA (g and h) or transfected to express myc-tagged wt NLRC5 or isoform 3 and then mock infected [U] or infected with O. tsutsugamushi [I] (i, j). g, i Input lysates, Flag IP complexes, and whole cell lysates were analyzed by immunoblot. Red asterisks denote the bands of interest. h, j Densitometric quantification of the myc:GAPDH signal was normalized to Flag-Ank5-F-boxAAAAA (h) or uninfected (j) cells (black bars) (n = 3 independent experiments). k, l HeLa cells were transfected to express indicated proteins, sorted on GFP positivity, mock infected [U] or infected with O. tsutsugamushi [I], and treated with IFNγ. k Whole cell lysates were analyzed by immunoblot. l Densitometric quantification of the NLRC5:GAPDH signal (n = 3 independent experiments). Indicators of statistical significance between pairs of uninfected (black bars) and infected (white bars) samples are colored black. Indicators of statistical significance between transfected and uninfected samples compared to uninfected cells expressing GFP-Ank5 are colored blue. Vertical lines between bands indicate where the blot was cropped or imaged separately. Data are means ± SD. Unpaired two-tailed t-test (b, d, h, j, l) was used for data analysis. Source data are provided as Source Data file.
Fig. 6
Fig. 6. Ank5 inhibits MHC class I expression in an AR4-dependent but F-box-independent manner.
ai HeLa cells were transfected to express indicated proteins, treated with IFNγ or vehicle control, and sorted on GFP-positivity. ac Total RNA was collected and RT-qPCR was performed using gene-specific primers. Relative expression of NLRC5-to-GAPDH (a), HLA-A-to-GAPDH (b), and β2M-to-GAPDH (c) was determined using the 2-∆∆CT method in which conditional values were normalized to those values of GFP-expressing cells treated with IFNγ (black bars). (n = 5 independent experiments). dg Whole cell lysates were collected from sorted cells and analyzed by immunoblot (d). Vertical lines between bands indicate where the blot was cropped or imaged separately. eg The densitometric signal of NLRC5 (e), HLA-ABC (f), or β2 M (g) was divided by the corresponding GAPDH densitometric signal and normalized to GFP-expressing cells treated with IFNγ (black bars) (n = 3 independent experiments). h, i Surface levels of MHC class I from sorted cells were analyzed by flow cytometry. h Representative histograms of MHC class I levels normalized to mode. Unlabeled (black) samples served as the control. [–] denotes vehicle control and [+] denotes IFNγ addition. i The mean fluorescence intensity of each sample was divided by that of its unlabeled control per replicate (n = 4 independent experiments). Data are means ± SD. One-way ANOVA with Dunnett’s post hoc test (ac), Unpaired two-tailed t-test (eg), and One-way ANOVA with Tukey’s post hoc test (i) were used for data analysis. Source data are provided as Source Data file.
Fig. 7
Fig. 7. NLRC5 K-to-R mutants are resistant to O. tsutsugamushi-induced degradation and antagonize Orientia mediated reduction of MHC class I surface levels.
ac HeLa cells expressing indicated proteins were treated with IFNγ or vehicle, sorted on GFP-positivity, and resolved into cytoplasmic [C] and nuclear [N] fractions. a Samples were analyzed by immunoblot. b, c The densitometric signal of cytoplasmic (b) or nuclear (c) NLRC5 was divided by that of Hsp90 or lamin A/C, respectively (n = 3 independent experiments). d, e HeLa cells were transfected to co-express indicated myc-NLRC5 proteins and Flag-tagged Ank5. d Inputs and Flag IP complexes were analyzed by immunoblot. e Densitometric quantification of myc:GAPDH signal from inputs (n = 3 independent experiments). f, g HeLa cells were transfected to express indicated GFP-NLRC5 proteins, mock infected [U] or infected with O. tsutsugamushi [I], and treated with IFNγ at 2 h p.i. (f) At 24 h p.i., whole cell lysates were immunoblotted. g Densitometric quantification of GFP:GAPDH signal from inputs was normalized to matched uninfected controls (n = 7 independent experiments). h HeLa cells were transfected to co-express Flag-BAP or Flag-Ank5 with indicated GFP-NLRC5 proteins and treated with IFNγ or vehicle (n = 4 independent experiments). MHC class I surface levels of GFP-positive cells were analyzed by flow cytometry. Indicators of statistical significance between pairs of untreated (black bars) and IFNγ-treated (white bars) samples are colored black, between untreated samples compared to BAP [–] are colored blue, and between IFNγ-treated samples compared to BAP [+] are colored red. i U and I HeLa cells were transfected to express indicated GFP-NLRC5 proteins and treated with IFNγ or vehicle for 24 h (n = 3 or 4 independent experiments). At 48 h p.i., samples were collected and assessed for MHC-I surface levels by flow cytometry. Fold change mean fluorescence intensity (MFI) was calculated by subtracting the MFI of each vehicle control-treated sample from that of its IFNγ-treated counterpart and then dividing that by its vehicle control. Data are means ± SD. One-way ANOVA with Dunnett’s post hoc test (b, c, h) and Unpaired two-tailed t-test (e, g, h, i) were used for data analysis. Source data are provided as Source Data file.
Fig. 8
Fig. 8. Model for how O. tsutsugamushi Ank5 targets NLRC5 to reduce MHC class I surface expression.
Ank5 utilizes its fourth AR to bind the N-terminal portion of NLRC5 and retain the transactivator in the cytoplasm. Ank5 also uses its F-box to direct SCF-mediated ubiquitination of the NLRC5 C-terminal leucine-rich repeat (LRR) domain, which promotes NLRC5 proteasomal degradation. This dual-action mechanism prevents MHC class I gene transactivation to ultimately lower MHC class I levels on the cell surface. Created with BioRender.com, released under a Creative Commons Attribution-Noncommercial-NoDerivs 4.0 International license.

Similar articles

Cited by

References

    1. Jongsma, M. L. M., Guarda, G. & Spaapen, R. M. The regulatory network behind MHC class I expression. Mol. Immunol.113, 16–21 (2019). 10.1016/j.molimm.2017.12.005 - DOI - PubMed
    1. Ibana, J. A. et al. Chlamydia trachomatis immune evasion via downregulation of MHC class I surface expression involves direct and indirect mechanisms. Infect. Dis. Obstet. Gynecol.2011, 420905 (2011). 10.1155/2011/420905 - DOI - PMC - PubMed
    1. Vachiery, N., Trap, I., Totte, P., Martinez, D. & Bensaid, A. Inhibition of MHC class I and class II cell surface expression on bovine endothelial cells upon infection with Cowdria ruminantium. Vet. Immunol. Immunopathol.61, 37–48 (1998). 10.1016/S0165-2427(97)00129-3 - DOI - PubMed
    1. Barrionuevo, P. & Giambartolomei, G. H. Inhibition of antigen presentation by Brucella: many more than many ways. Microbes Infect.21, 136–142 (2019). 10.1016/j.micinf.2018.12.004 - DOI - PubMed
    1. Meng, L. et al. PPE38 protein of mycobacterium tuberculosis inhibits macrophage MHC class I expression and dampens CD8(+) T cell responses. Front. Cell Infect. Microbiol.7, 68 (2017). 10.3389/fcimb.2017.00068 - DOI - PMC - PubMed

Publication types

MeSH terms

Substances

LinkOut - more resources