. 2024 Sep 14;15(1):8060.
doi: 10.1038/s41467-024-52460-w.

Epidemiological characteristics and transmission dynamics of dengue fever in China

Affiliations

Epidemiological characteristics and transmission dynamics of dengue fever in China

Haobo Ni et al. Nat Commun. .

Abstract

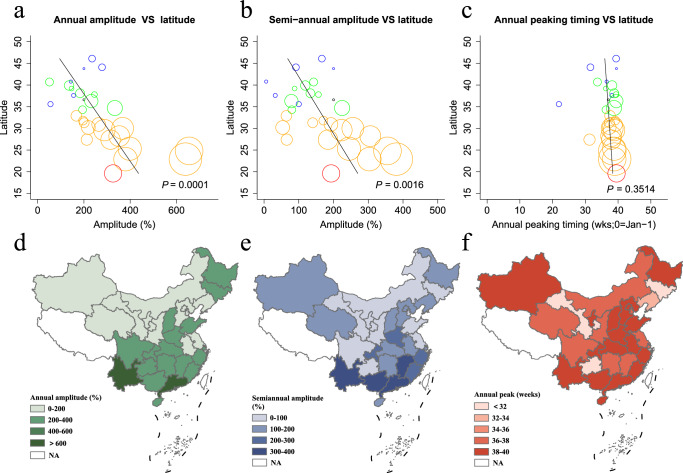
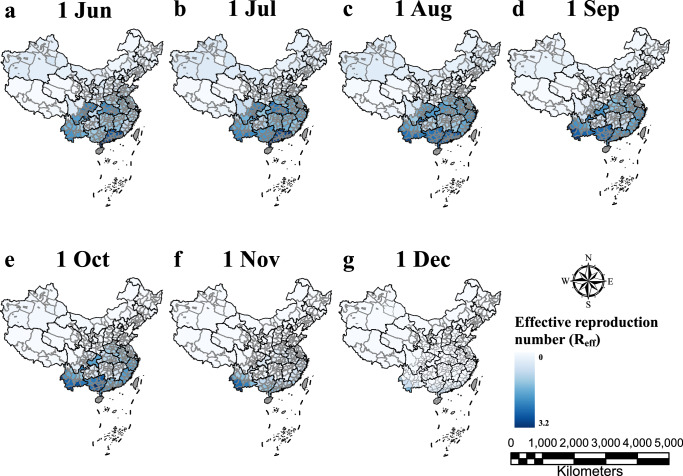
China has experienced successive waves of dengue epidemics over the past decade. Nationwide data on 95,339 dengue cases, 89 surveillance sites for mosquito density and population mobility between 337 cities during 2013-20 were extracted. Weekly dengue time series including time trends and harmonic terms were fitted using seasonal regression models, and the amplitude and peak timing of the annual and semiannual cycles were estimated. A data-driven model-inference approach was used to simulate the epidemic at city-scale and estimate time-evolving epidemiological parameters. We found that the geographical distribution of dengue cases was expanding, and the main imported areas as well as external sources of imported cases changed. Dengue cases were predominantly concentrated in southern China and it exhibited an annual peak of activity, typically peaking in September. The annual amplitude of dengue epidemic varied with latitude (F = 19.62, P = 0.0001), mainly characterizing by large in southern cities and small in northern cities. The effective reproduction number Reff across cities is commonly greater than 1 in several specific months from July to November, further confirming the seasonal fluctuations and spatial heterogeneity of dengue epidemics. The results of this national study help to better informing interventions for future dengue epidemics in China.


Conflict of interest statement

The authors declare no competing interests.

Figures

Fig. 1
Fig. 1. Spatial and temporal distribution of local and imported cases of dengue fever, 2013-2020.
a Spatial distribution of local and imported dengue cases (log-transformed scale). The shades of red in the city blocks indicate the severity of local cases, with three breakpoints: 1.10, 3.22 and 5.88, while the shades of blue in the city blocks indicate the severity of imported cases, with three breakpoints: 0.69, 2.40 and 4.11. The Jenks natural breaking method was used for data classification. The blue dashed line is Hu Line, a geographical demarcation line for population distribution and economic development in China. b Seasonal distribution of dengue cases, plotted as the sum of the weekly number of cases throughout the year from 2013 to 2020. c Time series of weekly cases of dengue. For (a)–(c), natural logarithmic transformation (ln(cases + 1)) is applied. As a widely used data normalization method, logarithm transformation of data was performed to make the data distribution more uniform in order to better explore the seasonal fluctuation characteristics of dengue incidence. d Time series of weekly probable, clinically diagnosed and laboratory-confirmed cases of dengue. The subfigure providing a zoomed-in view of the weekly dengue cases on the vertical coordinate. e Source-sink relationships between original countries with imported dengue cases and Chinese provincial administrations with relatively high imported cases. f Relationships between original countries with imported dengue cases and Chinese provinces with relatively low imported cases. g Temporal distribution of imported dengue cases across provinces.
Fig. 2
Fig. 2. Characteristics of a latitudinal gradient in the periodicity and peak timing of dengue fever epidemics in China.
a Amplitude of the annual periodicity (F = 19.62, P = 0.0001). b Amplitude of the semi-annual periodicity (F = 12.24, P = 0.0016). c Timing of primary annual dengue fever peak, in weeks from 1st January (F = 0.90, P = 0.3514). Colors represent different climatic zones (red = tropical, yellow = sub-tropical, green = warm-temperate, blue = mid-temperate, black = cold-temperate). Symbol size is proportional to the number of dengue cases in each province. The solid black line indicates a linear regression fit (regression weighted by the average annual number of dengue fever cases). The results of the F test and the corresponding P values were employed to testing the significance of the linear regression fit. P values are given on the graphs. d Amplitude of the annual periodicity in each province. e Amplitude of the semiannual periodicity in each province. f Timing for primary annual peak of dengue fever in each province. NA in the legend indicates that the region is temporarily unable to calculate these indicators (No dengue cases are reported in Tibet during the study time, and data for Hong Kong, Macau, Taiwan, Spratly Islands, and other parts of China outside of mainland China are not currently available).
Fig. 3
Fig. 3. Model fitting and estimation of national dengue infections.
a, cf Model fit for the number of daily dengue cases (orange star symbols) in China as a whole and for four urban agglomerations. The solid purple line indicates the median of the estimates. Dark shaded intervals and light shaded intervals indicate the interquartile range and 95% confidence intervals (CIs) of the estimates, respectively. b Confirmed dengue cases (yellow bars) and estimated monthly total infections (blue bars) in China. Distributions were obtained from 300 ensemble members. The blue bars represent medians and whiskers show 95% CIs.
Fig. 4
Fig. 4. Estimation of dengue infections and inference of time-varying transmission parameters in four urban metropolitans.
ad Confirmed dengue cases (yellow bars) and estimated monthly total infections (blue bars) in four urban metropolitans. Distributions were obtained from 300 ensemble members. The blue bars represent medians and whiskers show 95% CIs. eh Distribution of dengue transmission rates. il Distribution of dengue effective reproduction number. (mp) Distribution of dengue force of infection. The center and box boundaries represent the median (50th), 75th, and 25th percentiles, respectively. In the box plots, the poles of the whiskers represent the distance from the 75th percentile to the maxima and the 25th percentile to the minima, respectively. The posterior estimate for the day is also displayed. The distribution is derived from 300 ensembled members.
Fig. 5
Fig. 5. Estimates of effective reproduction numbers in cities.
(ag) Estimates of effective reproduction numbers for dengue on the first day of each month in each city. Blue shades represent the magnitude of the effective reproduction number, while gray shades represent the absence of inference.
Fig. 6
Fig. 6. Estimates of dengue infections in cities and the relationship between population mobility and dengue infections.
(ae) Estimates of the number of dengue infections in each city for each month and for the whole year. Redder colors in the cities indicate more severe infections, and the legends record the infections’ range of specific numbers. (fj) Estimated infections due to population movement in each city and the network of population movement intensity between cities. Estimated infections attributed to population movement in each city, along with a network illustrating the intensity of population movement among cities. Dots represent infections in cities. The thickness of the blue line represents the intensity of population movement between cities. (ko) Population outflows in five cities. The lines and dots indicate the location of the population outflow from the city. Larger pink dots indicate higher population outflows. Note that the South China Sea part in the figure k-o is consistent with the previous figure, which is not shown due to the limited space in the figure.

References

    1. Lin, Y., Fang, K., Zheng, Y., Wang, H. L. & Wu, J. Global burden and trends of neglected tropical diseases from 1990 to 2019. J. Travel Med29, taac031 (2022). 10.1093/jtm/taac031 - DOI - PubMed
    1. Ghorai, S. Editorial: Reviews in neglected tropical infectious diseases. Front Microbiol26, 1196838 (2023).10.3389/fmicb.2023.1196838 - DOI - PMC - PubMed
    1. Kraemer, M. U. G. et al. Past and future spread of the arbovirus vectors Aedes aegypti and Aedes albopictus. Nat. Microbiol4, 854–863 (2019). 10.1038/s41564-019-0376-y - DOI - PMC - PubMed
    1. WHO. Dengue-Global situation. https://www.who.int/emergencies/disease-outbreak-news/item/2023-DON498 (2023).
    1. Naddaf, M. Dengue is spreading in Europe: how worried should we be? Naturehttps://www.nature.com/articles/d41586-023-03407-6 (2023). - PubMed

Publication types