

Lewy body pathology exacerbates brain hypometabolism and cognitive decline in Alzheimer's disease
- PMID: 39277604
- PMCID: PMC11401923
- DOI: 10.1038/s41467-024-52299-1
Lewy body pathology exacerbates brain hypometabolism and cognitive decline in Alzheimer's disease
Abstract
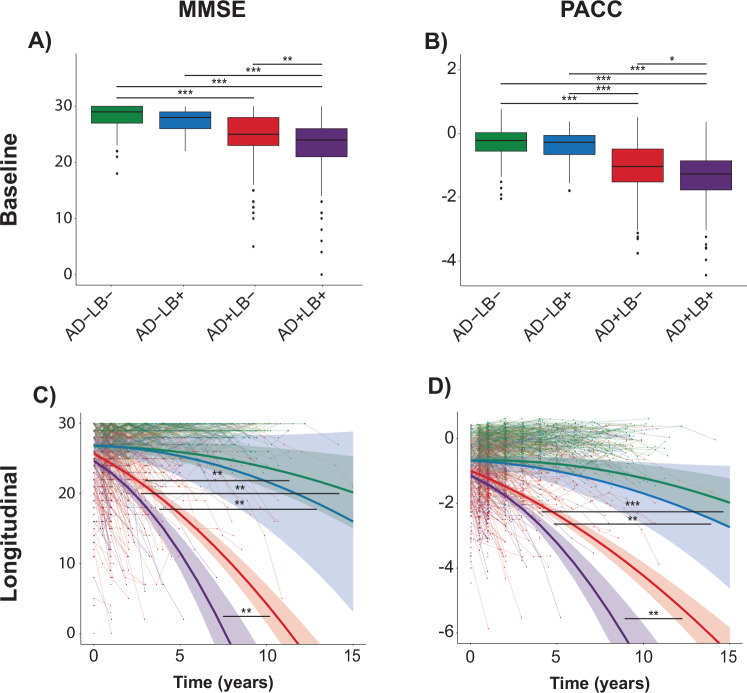
Identifying concomitant Lewy body (LB) pathology through seed amplification assays (SAA) might enhance the diagnostic and prognostic work-up of Alzheimer's disease (AD) in clinical practice and trials. This study examined whether LB pathology exacerbates AD-related disease progression in 795 cognitively impaired individuals (Mild Cognitive Impairment and dementia) from the longitudinal multi-center observational ADNI cohort. Participants were on average 75 years of age (SD = 7.89), 40.8% were female, 184 (23.1%) had no biomarker evidence of AD/LB pathology, 39 (4.9%) had isolated LB pathology (AD-LB+), 395 (49.7%) had only AD pathology (AD+LB-), and 177 (22.3%) had both pathologies (AD+LB+). The AD+LB+ group showed worst baseline performance for most cognitive outcomes and compared to the AD+LB- group faster global cognitive decline and more cortical hypometabolism, particularly in posterior brain regions. Neuropathological examination (n = 61) showed high sensitivity (26/27, 96.3%) and specificity (27/28, 96.4%) of the SAA-test. We showed that co-existing LB-positivity exacerbates cognitive decline and cortical brain hypometabolism in AD. In vivo LB pathology detection could enhance prognostic evaluations in clinical practice and could have implications for clinical AD trial design.
© 2024. The Author(s).
Conflict of interest statement
L.E.C. has acquired research support from GE Healthcare and Springer Healthcare (paid by Eli Lilly), both paid to institution. Dr. Collij’s salary is supported by the MSCA Postdoctoral fellowship (#101108819) and Alzheimer Association Research Fellowship (#23AARF-1029663) grants. O.H. has acquired research support (for the institution) from AVID Radiopharmaceuticals, Biogen, Eli Lilly, Eisai, Fujirebio, GE Healthcare, and Roche. In the past 2 years, he has received consultancy/speaker fees from AC Immune, Alzpath, BioArctic, Biogen, Bristol Meyer Squibb, Cerveau, Eisai, Eli Lilly, Fujirebio, Merck, Novartis, Novo Nordisk, Roche, Sanofi and Siemens. R.O. has received research funding from European Research Council, ZonMw, NWO, National Institute of Health, Alzheimer Association, Alzheimer Nederland, Stichting Dioraphte, Cure Alzheimer’s fund, Health Holland, ERA PerMed, Alzheimerfonden, Hjarnfonden (all paid to the institutions). R.O. has received research support from Avid Radiopharmaceuticals, Janssen Research & Development, Roche, Quanterix and Optina Diagnostics, and has given lectures in symposia sponsored by GE Healthcare. He is an advisory board member for Asceneuron and Bristol Myers Squibb. All the aforementioned has been paid to the institutions. He is an editorial board member of Alzheimer’s Research & Therapy and the European Journal of Nuclear Medicine and Molecular Imaging. S.P. has acquired research support (for the institution) from ki elements / ADDF and Avid. In the past 2 years, he has received consultancy/speaker fees from Bioartic, Biogen, Esai, Lilly, and Roche. N.M.C. has received funding from WASP and DDLS Joint call for research projects (WASP/DDLS22-066), EU Join Program Neurodegenerative Diseases (2019-03401). The remaining authors declare no competing interests.
Figures


Comment in
-
Lewy body pathology accelerates AD progression.Nat Rev Neurol. 2024 Nov;20(11):643. doi: 10.1038/s41582-024-01028-9. Nat Rev Neurol. 2024. PMID: 39402244 No abstract available.
References
-
- Bellomo, G. et al. α-Synuclein seed amplification assays for diagnosing synucleinopathies. Way Forw.99, 195–205 (2022). - PubMed
Publication types
MeSH terms
Substances
LinkOut - more resources
Full Text Sources
Medical
