. 2024 Sep 14;15(1):8078.
doi: 10.1038/s41467-024-51861-1.

Gain control of sensory input across polysynaptic circuitries in mouse visual cortex by a single G protein-coupled receptor type (5-HT2A)

Affiliations

Gain control of sensory input across polysynaptic circuitries in mouse visual cortex by a single G protein-coupled receptor type (5-HT2A)

Ruxandra Barzan et al. Nat Commun. .

Abstract

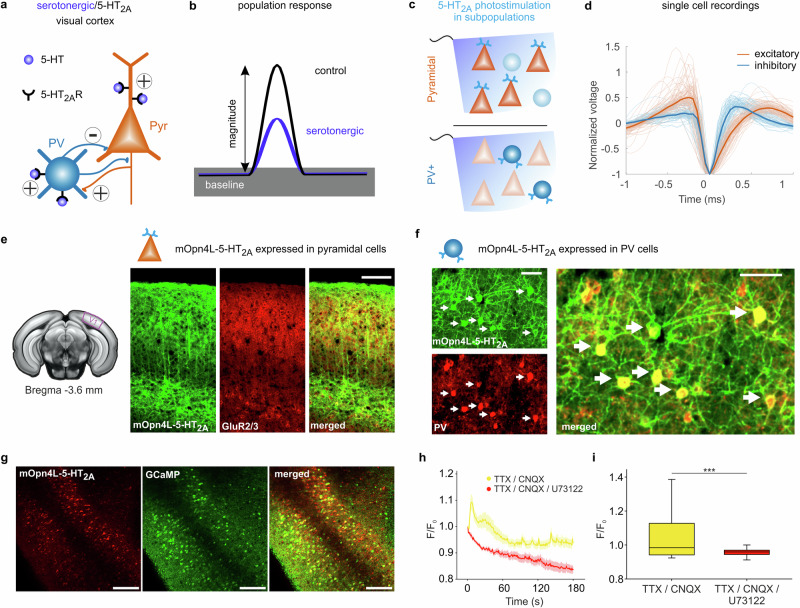
Response gain is a crucial means by which modulatory systems control the impact of sensory input. In the visual cortex, the serotonergic 5-HT2A receptor is key in such modulation. However, due to its expression across different cell types and lack of methods that allow for specific activation, the underlying network mechanisms remain unsolved. Here we optogenetically activate endogenous G protein-coupled receptor (GPCR) signaling of a single receptor subtype in distinct mouse neocortical subpopulations in vivo. We show that photoactivation of the 5-HT2A receptor pathway in pyramidal neurons enhances firing of both excitatory neurons and interneurons, whereas 5-HT2A photoactivation in parvalbumin interneurons produces bidirectional effects. Combined photoactivation in both cell types and cortical network modelling demonstrates a conductance-driven polysynaptic mechanism that controls the gain of visual input without affecting ongoing baseline levels. Our study opens avenues to explore GPCRs neuromodulation and its impact on sensory-driven activity and ongoing neuronal dynamics.


Conflict of interest statement

The authors declare no competing interests.

Figures

Fig. 1
Fig. 1. Gain control in the visual cortex via serotonergic receptors.
a Schematics representing the localization and main modulatory synaptic effects of 5-HT2A receptors expressed in pyramidal and parvalbumin (PV) neurons in the mouse cortex. b 5-HT2A receptors are known to reduce the gain of visually evoked responses without affecting baseline levels of activity. c 5-HT2A receptor activation in populations of either pyramidal or PV neurons was controlled optogenetically by light. d Silicon probe recordings allowed source separation of responses of putative excitatory or inhibitory neurons based on analysis of waveform features (see “Methods” section). e Left to right: coronal slice of the mouse brain with V1 location marked; confocal scans of slices with mOpn4L-5-HT2A expression (green) in a NEX-Cre mouse, antibody against GluR2/3 (red) and the merged image. f Same as (e) for a PV-Cre mouse with antibody against PV (red). Arrows point to double-positive cells. The scans in (e, f) represent areas enlarged in Extended Data Fig. 3b and Extended Data Fig. 4a, respectively. g 2-Photon fluorescence images of V1 cortical slice from a NEX-Cre mouse showing expressing of mOpn4L-mCherry-5-HT2A (left) and GCaMP (middle) in pyramidal neurons, merged image (right). Images in (eg) are representative of three independent experiments. h Time course of Ca2+-dependent changes in fluorescence during 3 min blue light activation under the influence of TTX/CNQX (n = 103 cells) or TTX/CNQX/U73122 (see “Methods” section) (n  = 50 cells). Traces and shadings represent mean ± SEM. i Comparison of the amplitude of all cells depicted in (h) at the time of peak during TTX/CNQX and TTX/CNQX/U73122 applications. Box plots indicate median (middle line), 25th, 75th percentile (box), 10th, and 90th percentile (whiskers), ***p = 0.0007, two-sided Mann–Whitney U-test. Scale bars: 100 µm in (e), 50 µm in (f), and 25 µm in (g). Source data are provided as a Source Data file.
Fig. 2
Fig. 2. Cell-type-specific activation of the 5-HT2A receptor pathway and modulations of spontaneous activity.
a Photostimulation of the 5-HT2A receptor pathway in pyramidal neurons. Left: Scheme of paradigm. Middle: spontaneous activity of excitatory neurons upon photostimulation (Sph, dark orange), and under control condition (S, gray (throughout figure)). Blue bar shows the photostimulation time. Right: same conditions for the recorded pool of inhibitory neurons. Data represent mean ± SEM (shadings) of n = 55 excitatory units and n = 44 inhibitory units in 11 NEX-Cre mice. b Quantification (mean, error bars show + SEM) of the normalized firing rates in (a) in the time interval of 10–13 s (marked as ‘POST’ in a), (color scheme as in a). c Violin plots of opto-index (OI, see formula) values of all excitatory (dark orange circles) and inhibitory (light blue circles) neurons presented in (a, b), with kernel density estimation for the two populations; the left plot shows values for controls using OI-congruent PRE and POST times. d Activity of excitatory neurons (dark orange) with positive OI (solid line, SphOI+, n = 39) and negative OI (stippled line, SphOI−, n = 16) and activity of inhibitory neurons (light blue; SphOI+, n = 21, SphOI−, n = 22). Data represent mean ± SEM (shadings). e Data in (d) quantified as in (b) (color scheme as in d). f Photostimulation of the 5-HT2A receptor pathway in PV interneurons. Middle: pool of inhibitory neurons during control condition (S, gray) and following photostimulation (Sph, dark blue). Right: pool of excitatory neurons recorded under same conditions, control (gray) and with photostimulation (light orange). Data represents mean ± SEM (shadings) of n = 73 inhibitory units (37 with OI+, 36 with OI−) and n = 56 excitatory units (6 with OI+, 50 with OI−) recorded in 14 PV-Cre mice. g Quantification of normalized firing rates in (f) (averaged over same time interval as in a). (h, i, j) Same analysis and conventions as in (ce) for data shown in (f). ***p < 0.001, **p < 0.01, and *p < 0.05, two-sided paired sample t-test in (b and g), one-sided in (e and j) or two-sample Kolmogorov–Smirnov test in (h). Exact p-values of all comparisons are reported in the Source Data file.
Fig. 3
Fig. 3. Cell-type-specific activation of the 5-HT2A receptor pathway and modulations of evoked activity.
a, b Visual responses (dots indicate visual stimulus timing) in control conditions (V, black) and with additional 5-HT2A receptor activation (Vph, blue; horizontal bars). Gray traces represent (Vph-V). a Photostimulation of the 5-HT2A pathway in pyramidal neurons. Normalized evoked activity of excitatory and inhibitory neurons (dark orange and blue box, respectively), mean ± SEM (shadings) of n = 55 excitatory units and n = 44 inhibitory units 11 in NEX-Cre mice. b Photostimulation of the 5-HT2A pathway in PV interneurons. Normalized evoked activity of inhibitory and excitatory neurons (dark blue and light orange box, respectively), mean ± SEM (shadings) of n = 73 inhibitory units and n = 56 excitatory units recorded in 14 PV-Cre mice. c Violin plot of opto-index (OI) based on response magnitude (difference between peak amplitude and baseline, see scheme at left) for excitatory (dark orange circles) and inhibitory (light blue circles) neurons in (a). Compared are values for the control visual stimulus #1 (pre-photostimulation) and stimulus #4 (during photostimulation; x-axis in (e) shows stimulus numbering). d Violin plot of the same analysis as in (c) for data shown in (b). ***p = 0.0007, two-sample Kolmogorov–Smirnov test. e Quantification of response magnitude of the conditions shown in (a, b). Color scheme denotes cell type and is matched to box colors above. ***p < 0.00017, **p < 0.0017, two-sided paired sample t-test with Bonferroni correction; exact p-values of comparisons are reported in the Source Data file. f Comparison between response magnitude evoked by stimulus #1 and the average of magnitude values obtained for stimuli #2–4 for each excitatory unit during optogenetic activation of 5-HT2A in PV interneurons (see b, right). Control (V, black circles), photostimulation conditions (Vph, blue circles), data normalized to the unit with the highest firing rate (n = 58). Lines represent linear regression for V and Vph, identity line (dashed red). Inset represents regression coefficients (mean ± SEM, n = 116). The negative value of the coefficient β4 indicates divisive reduction of the magnitude in the Vph condition. ***p = 6.09 × 10−372), *p = 0.044 (β4), two-sided one-sample t-test. Source data are provided as a Source Data file.
Fig. 4
Fig. 4. Systemic activation of the 5-HT2A pathway in pyramidal and parvalbumin neurons stabilizes spontaneous activity levels and controls visual input gain.
a Left: Scheme of paradigm. Right: Quantification of the normalized spontaneous firing rates, dark blue representing inhibitory neurons (n = 13) and dark orange excitatory neurons (n = 14), mean recording depth 318 µm ±78 (SD) in 5 PV-Cre mice (for average time traces see Extended Data Fig. 10). Box plots indicate median (middle line), 25th, 75th percentile (box), ±2.7 sigma (whiskers), outliers are plotted as ‘o’; ns not significant, two-sided paired sample t-test with Bonferroni correction. b Quantification of response magnitude for each visual stimulus (calculated as in Fig. 3e). Data represent mean, error bars show ± SEM. Color scheme denotes cell type. ***p < 0.00017, **p < 0.0017, *p < 0.0083, two-sided one-sample t-test with Bonferroni correction for multiple comparisons; exact p-values are reported in the Source Data file. c Comparison of response magnitude before photostimulation (V, visual stimulus #1, black circles) and during photostimulation (Vph, average across visual stimuli #2–4, blue circles) for each excitatory unit in (a, b), regression equations are depicted with corresponding colors, lines represent linear regression for V and Vph (dashed red line represents identity line). Data was normalized to the unit with the highest firing rate. Inset represents regression coefficients (mean ± SEM, n = 28). The negative value of the coefficient β4 indicates significant divisive reduction of the magnitude in the Vph condition. ***p = 3.78 × 10−132), **p = 0.0018 (β4), two-sided one-sample t-test. d same as (c) for all inhibitory units in (a, b) (mean ± SEM, n = 26, ***p = 2.19 × 10−92), ***p = 7.33 × 10−54), two-sided one-sample t-test). Source data are provided as a Source Data file.
Fig. 5
Fig. 5. Cortical network model predicts 5-HT2A receptor-induced modulations in activity.
a Left: Schematics of the spiking network model showing interactions between different pools of neurons (excitatory, inhibitory), activation of the 5-HT2A receptor, and visual input. 5-HT2A receptor activation in only excitatory units revealed changes in spontaneous firing (middle) and stimulus-evoked magnitude (right) for excitatory units (dark orange) and inhibitory units (light blue) dependent on the percentage of excitatory units with activated 5-HT2A receptors. b 5-HT2A receptor activation in only inhibitory units. Same analysis as in (a). Color saturation in (a, b) indicates that the 5-HT2A receptor was activated in the analyzed type of unit (“direct effect”, dark colors) or instead affects the analyzed unit via (poly-) synaptic contacts (“indirect network effects”, light colors,); color scheme as in Figs. 2 and 3. c Mean-driven regime: Predicted effects of “systemic” activation (simultaneous activation of 5-HT2A in both excitatory and inhibitory units) on baseline firing (middle) and visual response magnitude (right) assuming linear superposition of the model values shown in (a, b). Blue shaded area marks the range of suppression of visual gain observed for systemic activation in the current study (−32% and −25% (average across stim #2–4) for excitatory (orange stippled line) and inhibitory neurons (light blue stippled line), respectively) and of presumably 5-HT2A receptor-induced suppression reported in previous studies (−21% and −67%, dark blue stippled lines). d Same as (c) for the fluctuation-driven regime. e Left: Average excitatory (orange) and inhibitory (blue) conductance predicted by the model with no 5-HT2A activation (0%) and during systemic 5-HT2A receptor activation in 50% of all cells (please note the different Y scales). Visual stimulation time is indicated by the black bar, blue marks receptor activation. Right: Firing rate with no 5-HT2A stimulation (0%) and during systemic 5-HT2A activation in 50% of all cells. Note that the increase in conductance following 5-HT2A activation leads to suppression of the response to visual input without changes in spontaneous firing rate. Source data are provided as a Source Data file.

Similar articles

Cited by

References

    1. Dayan, P. & Abbott, L. F. Theoretical Neuroscience: Computational and Mathematical Modeling of Neural Systems (Massachusetts Institute of Technology Press, 2001).
    1. Deco, G., Tononi, G., Boly, M. & Kringelbach, M. L. Rethinking segregation and integration: contributions of whole-brain modelling. Nat. Rev. Neurosci.16, 430–439 (2015). 10.1038/nrn3963 - DOI - PubMed
    1. Ferguson, K. A. & Cardin, J. A. Mechanisms underlying gain modulation in the cortex. Nat. Rev. Neurosci.21, 80–92 (2020). 10.1038/s41583-019-0253-y - DOI - PMC - PubMed
    1. Wilson, N. R., Runyan, C. A., Wang, F. L. & Sur, M. Division and subtraction by distinct cortical inhibitory networks in vivo. Nature488, 343–348 (2012). 10.1038/nature11347 - DOI - PMC - PubMed
    1. Lee, S.-H. et al. Activation of specific interneurons improves V1 feature selectivity and visual perception CAMKIIα-Arch Light-on Light-on. Nature488, 379–383 (2012). 10.1038/nature11312 - DOI - PMC - PubMed

Publication types

Grants and funding

LinkOut - more resources