

Sexual behavior is linked to changes in gut microbiome and systemic inflammation that lead to HIV-1 infection in men who have sex with men
- PMID: 39277660
- PMCID: PMC11401892
- DOI: 10.1038/s42003-024-06816-z
Sexual behavior is linked to changes in gut microbiome and systemic inflammation that lead to HIV-1 infection in men who have sex with men
Abstract
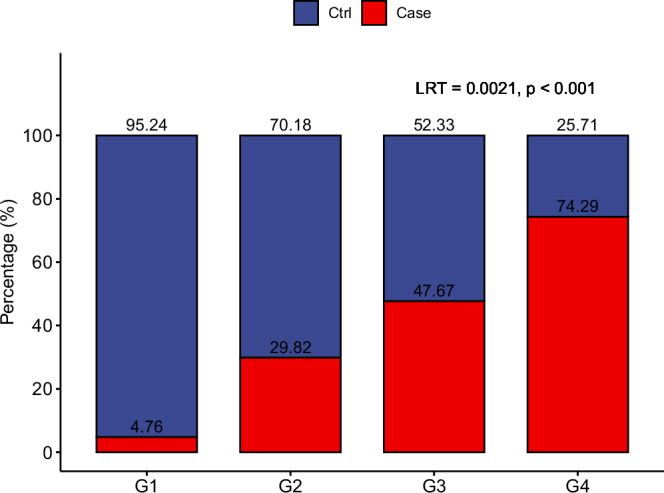
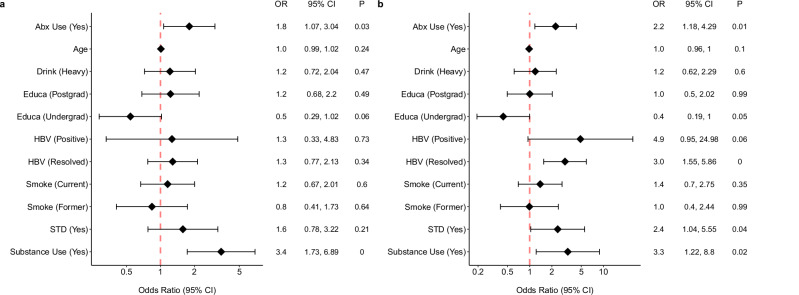
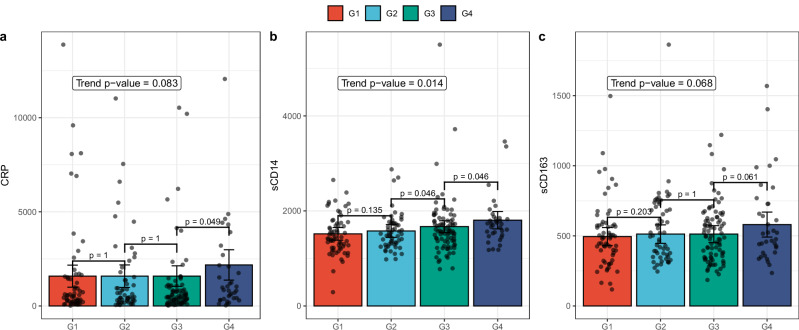
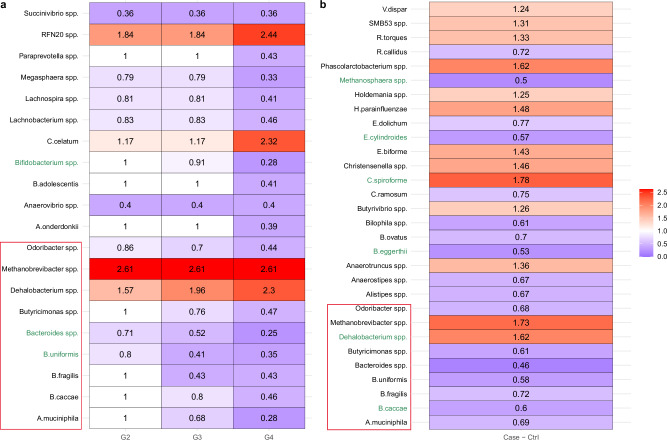
Pathogenic changes in gut microbial composition precede the onset of HIV-1 infection in men who have sex with men (MSM). This process is associated with increased levels of systemic inflammatory biomarkers and risk for AIDS development. Using mediation analysis framework, in this report we link the effects of unprotected receptive intercourse among MSM prior to primary HIV-1 infection to higher levels of proinflammatory cytokines sCD14 and sCD163 in plasma and a significant decrease in the abundance of A. muciniphila, B. caccae, B. fragilis, B. uniformis, Bacteroides spp., Butyricimonas spp., and Odoribacter spp., and a potential increase in the abundance of Dehalobacterium spp. and Methanobrevibacter spp. in stools of MSM with the highest number of sexual partners. These differences in microbiota, together with a reduction in the pairwise correlations among commensal and short-chain fatty acid-producing bacteria with a number of sexual partners, support an increase in gut dysbiosis with the number of sexual partners. These results demonstrate the interconnectedness of sexual behavior, immune response, and microbiota composition, notably among MSM participating in high-risk sexual behaviors.
© 2024. This is a U.S. Government work and not under copyright protection in the US; foreign copyright protection may apply.
Conflict of interest statement
The authors declare no competing interests.
Figures
Update of
-
The effect of sexual behavior on HIV-1 seroconversion is mediated by the gut microbiome and proinflammatory cytokines.Res Sq [Preprint]. 2024 Jan 24:rs.3.rs-3868545. doi: 10.21203/rs.3.rs-3868545/v1. Res Sq. 2024. Update in: Commun Biol. 2024 Sep 14;7(1):1145. doi: 10.1038/s42003-024-06816-z. PMID: 38343862 Free PMC article. Updated. Preprint.
Similar articles
-
The effect of sexual behavior on HIV-1 seroconversion is mediated by the gut microbiome and proinflammatory cytokines.Res Sq [Preprint]. 2024 Jan 24:rs.3.rs-3868545. doi: 10.21203/rs.3.rs-3868545/v1. Res Sq. 2024. Update in: Commun Biol. 2024 Sep 14;7(1):1145. doi: 10.1038/s42003-024-06816-z. PMID: 38343862 Free PMC article. Updated. Preprint.
-
Signature changes in gut microbiome are associated with increased susceptibility to HIV-1 infection in MSM.Microbiome. 2021 Dec 9;9(1):237. doi: 10.1186/s40168-021-01168-w. Microbiome. 2021. PMID: 34879869 Free PMC article.
-
Gut resistome linked to sexual preference and HIV infection.BMC Microbiol. 2024 Jun 8;24(1):201. doi: 10.1186/s12866-024-03335-z. BMC Microbiol. 2024. PMID: 38851693 Free PMC article.
-
HIV, Sexual Orientation, and Gut Microbiome Interactions.Dig Dis Sci. 2020 Mar;65(3):800-817. doi: 10.1007/s10620-020-06110-y. Dig Dis Sci. 2020. PMID: 32030625 Free PMC article. Review.
-
The rectal microbiome: understanding its role in HIV transmission.Curr Opin HIV AIDS. 2025 Mar 1;20(2):159-164. doi: 10.1097/COH.0000000000000906. Epub 2024 Dec 16. Curr Opin HIV AIDS. 2025. PMID: 39773907 Review.
Cited by
-
Gut microbiota differences linked to weight gain and ART in people living with HIV are enterotype specific and minor compared to the large differences linked to sexual behavior.Front Cell Infect Microbiol. 2025 May 8;15:1568352. doi: 10.3389/fcimb.2025.1568352. eCollection 2025. Front Cell Infect Microbiol. 2025. PMID: 40406514 Free PMC article.
-
Significant associations between high-risk sexual behaviors and enterotypes of gut microbiome in HIV-negative men who have sex with men.mSphere. 2025 Jul 29;10(7):e0023225. doi: 10.1128/msphere.00232-25. Epub 2025 Jun 25. mSphere. 2025. PMID: 40558044 Free PMC article.
References
-
- United States DoHaHS, Centers for Disease Control and Prevention (eds) HIV Surveillance Report: Diagnoses of HIV infection in the United States and Dependent Areas, 2021 (CDC, 2023).
-
- United States DoHaHS, Centers for Disease Control and Prevention (eds) Preventing Sexual Transmission of HIV (CDC, 2023).
MeSH terms
Grants and funding
- U01 HL146333/HL/NHLBI NIH HHS/United States
- K01 AI162247/AI/NIAID NIH HHS/United States
- U01 HL146208/HL/NHLBI NIH HHS/United States
- ZIA ES103390-01/U.S. Department of Health & Human Services | NIH | National Institute of Environmental Health Sciences (NIEHS)
- N01-AI-32513, U01-HL-146208, and NIHS10OD023402/U.S. Department of Health & Human Services | National Institutes of Health (NIH)
LinkOut - more resources
Full Text Sources
Medical
Miscellaneous
