. 2024 Sep 14;7(1):1146.
doi: 10.1038/s42003-024-06867-2.

TUBB4B is essential for the cytoskeletal architecture of cochlear supporting cells and motile cilia development

Affiliations

TUBB4B is essential for the cytoskeletal architecture of cochlear supporting cells and motile cilia development

Urikhan Sanzhaeva et al. Commun Biol. .

Abstract

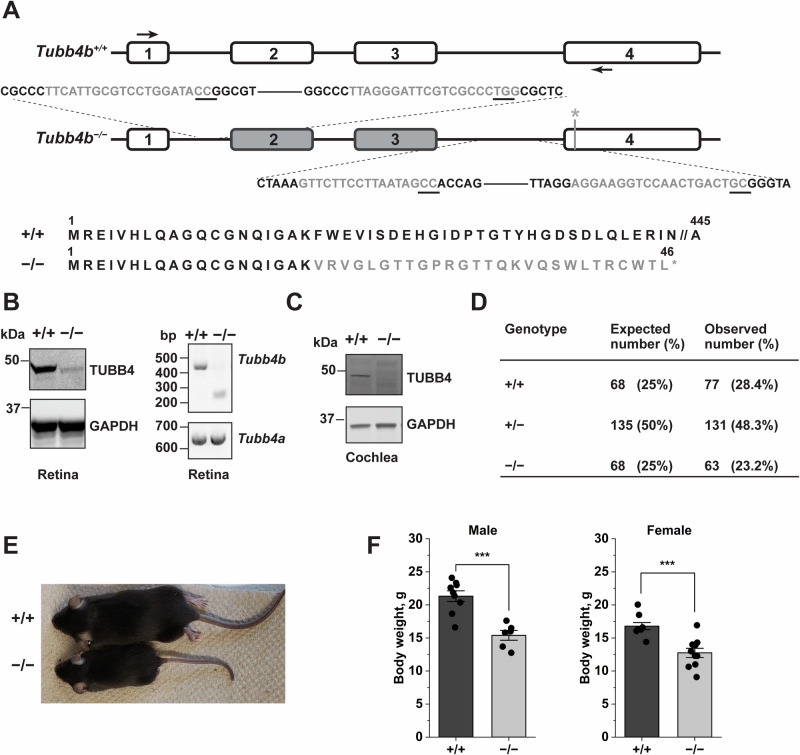
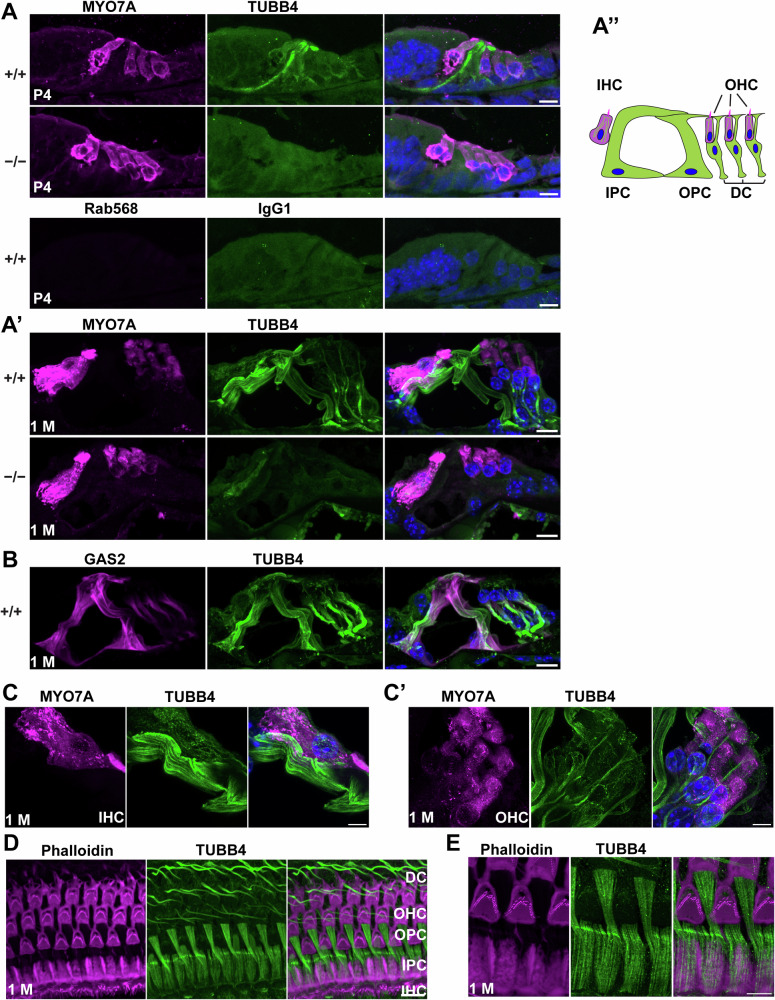
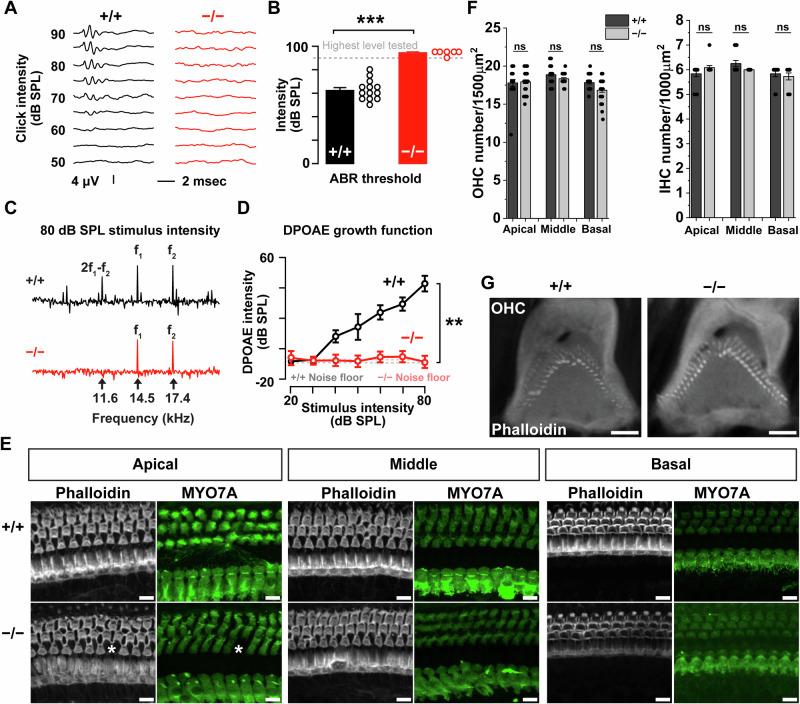
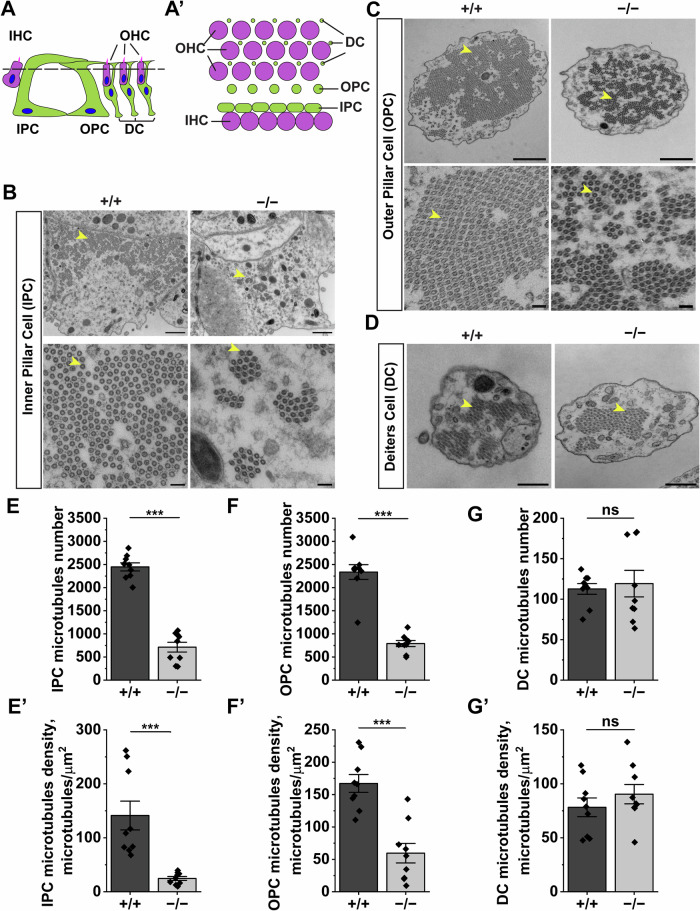
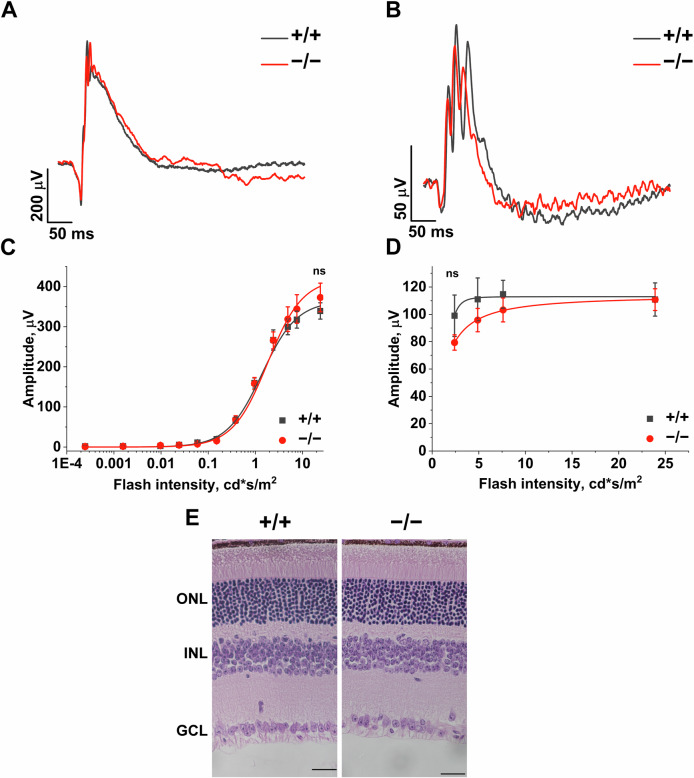
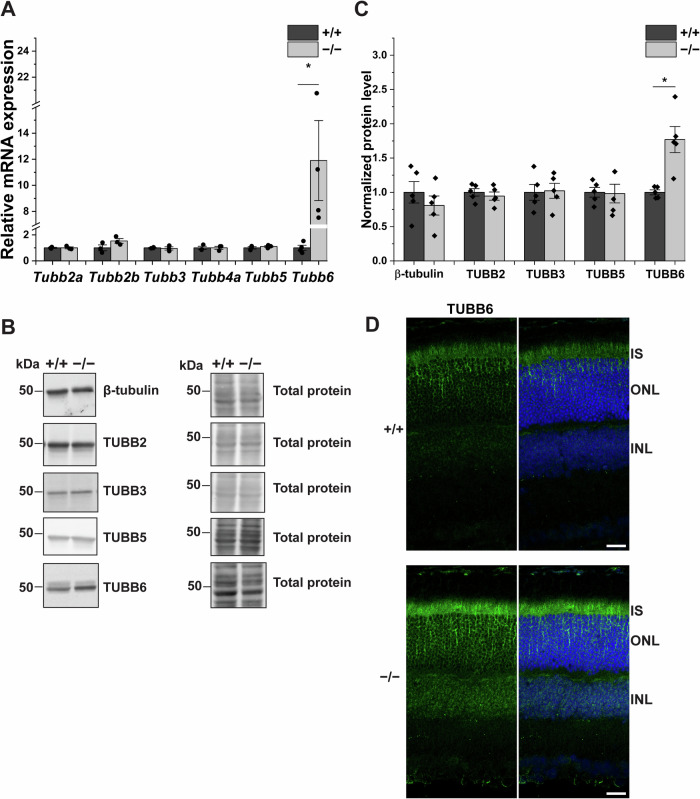
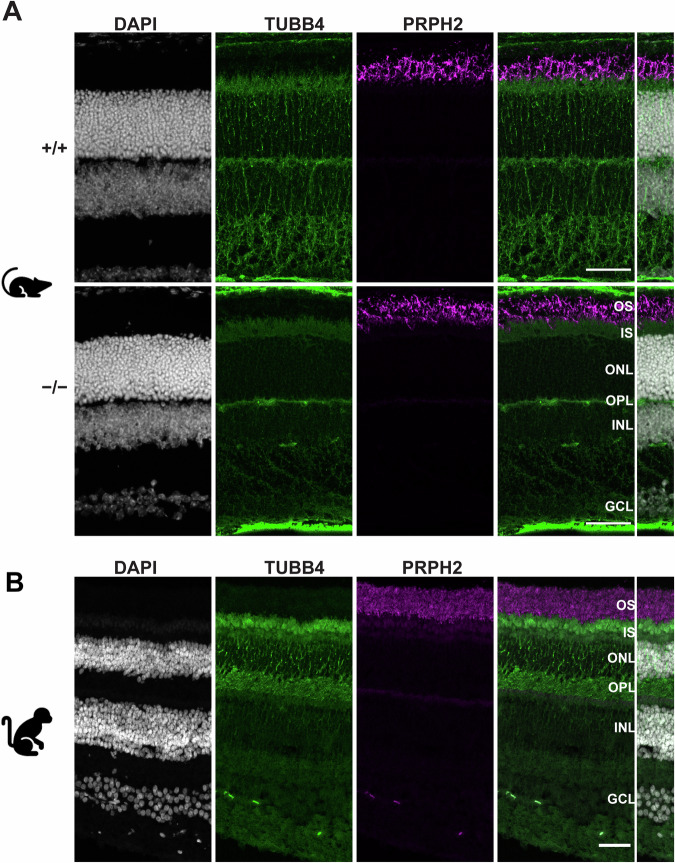
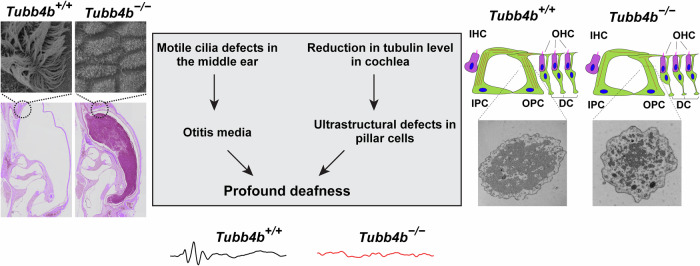
Microtubules are essential for various cellular processes. The functional diversity of microtubules is attributed to the incorporation of various α- and β-tubulin isotypes encoded by different genes. In this work, we investigated the functional role of β4B-tubulin isotype (TUBB4B) in hearing and vision as mutations in TUBB4B are associated with sensorineural disease. Using a Tubb4b knockout mouse model, our findings demonstrate that TUBB4B is essential for hearing. Mice lacking TUBB4B are profoundly deaf due to defects in the inner and middle ear. Specifically, in the inner ear, the absence of TUBB4B lead to disorganized and reduced densities of microtubules in pillar cells, suggesting a critical role for TUBB4B in providing mechanical support for auditory transmission. In the middle ear, Tubb4b-/- mice exhibit motile cilia defects in epithelial cells, leading to the development of otitis media. However, Tubb4b deletion does not affect photoreceptor function or cause retinal degeneration. Intriguingly, β6-tubulin levels increase in retinas lacking β4B-tubulin isotype, suggesting a functional compensation mechanism. Our findings illustrate the essential roles of TUBB4B in hearing but not in vision in mice, highlighting the distinct functions of tubulin isotypes in different sensory systems.


Conflict of interest statement

The authors declare no competing interests.

Figures

Fig. 1
Fig. 1. Validation of the Tubb4b−/− murine model.
A Schematic illustrating the mutation in Tubb4b generated by CRISPR-Cas9. gRNA sequences targeting the introns are shown in grey, with the protospacer adjacent motif (PAM) sequence underlined. Deletion of exons 2 and 3 led to changes to the amino acid sequence (grey) and introduces a premature stop codon (grey asterisk). Arrows in exons 1 and 4 indicate the locations of forward and reverse primers used for RT-PCR. B Left panel: Immunoblot of retinal lysates from P30 animals probed with TUBB4 antibody. The blots were also probed for GAPDH, a housekeeping protein serving as a control for protein loading. Molecular weights in kDa are indicated on the left. Right panel: RT-PCR analysis of the Tubb4b and Tubb4a mRNA extracted from retinal tissue, followed by agarose gel electrophoresis. Markers in base pairs (bp) are indicated on the left. Expected sizes for Tubb4b and Tubb4a are 434 bp and 619 bp, respectively. C Immunoblot of cochlear lysates from 1-month-old Tubb4b−/− and wildtype littermates, probed with TUBB4 and GAPDH antibodies. All experiments were replicated at least three times with littermates as controls (+/+). D The number of pups obtained from Tubb4b+/ crosses followed Mendelian ratios (total number of animals counted 271). Expected numbers were calculated as (total number of animals counted) * expected ratio (0.25 for +/+, − /−; 0.5 for +/−). The percentage of pups born for each genotype are indicated in the brackets. E Image of 1-month-old male Tubb4b−/− and control littermate. F Whole bodyweight of Tubb4b−/− and control littermates at 1 month. Data are presented as mean ± SEM. ***P value ≤ 0.001.
Fig. 2
Fig. 2. TUBB4B is expressed in cochlear hair cells and supporting cells.
A Cochlear cross-sections at P4 from wildtype controls and Tubb4b − /− littermates, stained with TUBB4 (green), MYO7A (magenta) antibodies, and DAPI (blue). The bottom panel shows the IgG1 isotype control. Scale bar = 10 μm. A’ Cochlear cross-sections from 1-month-old Tubb4b+/+ and Tubb4b/− mice stained with TUBB4 (green), MYO7A (magenta) antibodies, and DAPI (blue). Scale bar = 10 μm. A” Schematic illustration of TUBB4B expression in 1-month-old cochlear cross-sections, showing TUBB4B (green) and MYO7A (magenta). B Cochlear cross-sections from 1-month-old Tubb4b+/+ mice stained with TUBB4 (green), GAS2 (magenta) antibodies, and DAPI (blue). Scale bar = 10 μm. C High-resolution confocal images of inner hair cell (IHC) in cochlear cross-section stained with TUBB4 (green), MYO7A (magenta) antibodies, and DAPI (blue). Scale bar = 5 μm. C’ High-resolution confocal images of outer hair cells (OHC) in cochlear cross-section stained with TUBB4 (green), MYO7A (magenta, hair cells marker) antibodies, and DAPI (blue). Scale bar = 5 μm. D Cochlear wholemount from 1-month-old mice stained with TUBB4 (green) antibody and phalloidin (magenta). Scale bar = 10 μm. E High-resolution confocal images of pillar cells (PC) and phalangeal process of Deiters’ cell (DC) from cochlear whole mounts, stained with TUBB4 (green) antibody and phalloidin (magenta). Scale bar = 5 μm. IHC inner hair cell, IPC inner pillar cell, OPC outer pillar cell, OHC outer hair cell, DC Deiters’ cell.
Fig. 3
Fig. 3. Tubb4b−/− are profoundly deaf without significant hair cell degeneration.
A Representative auditory brainstem response (ABR) traces elicited by clicks in 1-month-old Tubb4b−/− mice (red) and control littermates (black). B Click ABR thresholds measured from 1-month-old Tubb4b−/− mice (n = 6, red) and control littermates (n = 13, black). Statistical analysis was conducted using an unpaired two-tailed t test. ***Denotes a significance level of P < 0.001. C Representative distortion product otoacoustic emissions (DPOAE) traces at 16 kHz from 1-month-old Tubb4b−/− mice (red) and control littermates (black). D DPOAE input/output function at 16 kHz frequency from 1-month-old Tubb4b−/− mice (n = 7, red) and control littermates (n = 5, black) recorded at each stimulus intensity level. Dashed lines denote the noise floor during the recordings. Statistical analysis was conducted using a two-way ANOVA. **Denotes a significance level of P < 0.01 between genotypes. E Cochlear whole mounts from apical, middle, and basal turns of 1-month-old wildtype and Tubb4b−/− littermates, stained with phalloidin (gray) and MYO7A (green) antibody. Missing outer hair cells are denoted with an asterisk. Scale bar = 10 μm. F Quantification of outer hair cells (OHC) and inner hair cells (IHC) in Tubb4b−/− and control littermates at 1 month. Regions of interest (50 μm × 30 μm for OHC or 50 μm × 20 μm for IHC) were selected in each cochlear turn, and the numbers of hair cells were manually counted. ns not significant. G High-resolution confocal images of OHCs from Tubb4b−/− and control cochlear whole mounts at 1 month, stained with phalloidin (gray). Scale bar = 1 μm. Data are presented as mean ± SEM.
Fig. 4
Fig. 4. The absence of TUBB4B leads to reduction in microtubules.
A Immunoblot analysis of cochlear lysates from 1-month-old wildtype and Tubb4b−/− littermates, probed with β-tubulin antibody. The blots were also probed for GAPDH, a housekeeping protein, serving as a loading control. The molecular weights in kDa are indicated on the left. B Quantification of β-tubulin levels from (A), normalized to total protein. Data are presented as mean ± SEM (n = 6, unpaired t test, two-tailed). C Cochlear whole mounts from 1-month-old mice wildtype and Tubb4b−/− littermates, stained with acetylated tubulin (magenta), α-tubulin (green) antibodies, and phalloidin (blue). The double arrow denotes the inner pillar cell head. Scale bar = 10 μm. D Inner pillar cell head length measured using acetylated tubulin staining of cochlear whole mounts from the apical turns of 1-month-old wildtype and Tubb4b−/− littermates. Data are presented as mean ± SEM (n = 3, Mann–Whitney U test). *** denotes a significance level of P < 0.001. E Cochlear wholemount images from basal turns of 1-month-old wildtype and Tubb4b−/− littermates, stained with α-tubulin (green). Scale bar = 10 μm. F Deiters’ cells phalangeal processes, cup, and stalk diameters measured from basal turns of 1-month-old wildtype and Tubb4b−/− littermates, stained with α-tubulin. Data are presented as mean ± SEM (n = 3, unpaired t test, two-tailed). *** denotes a significance level of P < 0.001; ns not significant. G Schematic illustration of Deiters’ cells phalangeal processes, cup and stalk locations used for diameter measurement. OHC outer hair cell, DC Deiters’ cell.
Fig. 5
Fig. 5. The cytoskeletal ultrastructure of supporting cells in the cochlea is dependent on TUBB4B.
A Schematic illustration of the organ of Corti in 1-month-old mice, with a dashed line indicating the transverse section plane used for transmission electron microscopy (TEM). A’ Additional illustration of the organ of Corti, sectioned through the plane shown in (A). B TEM micrographs of inner pillar cells (IPC). Yellow arrowheads point to microtubule cross-sections. Scale bars: 1 μm (top panel), 100 nm (bottom panel). C TEM micrographs of outer pillar cells (OPC), with yellow arrowheads pointing to microtubule cross-sections. Scale bars: 1 μm (top panel), 100 nm (bottom panel). D TEM micrographs of Deiters’ cells (DC) phalangeal processes, with yellow arrowheads pointing to microtubule cross-sections. Scale bar = 500 nm. E Quantification of microtubules number per IPC. E’ Quantification of IPC microtubules density (IPC microtubules number per cell cross-section area). F Quantification of microtubules number per OPC. F’ Quantification of OPC microtubules density (OPC microtubules number per cell cross-section area). G Quantification of microtubules number per DC phalangeal processes. G’ Quantification of DC phalangeal processes microtubules density (DC microtubules number per cell cross-section area). Data are presented as mean ± SEM (n = 3 samples, three cells per sample were analyzed, unpaired t test, two-tailed). *** denotes a significance level of P < 0.001; ns not significant. IHC inner hair cell, IPC inner pillar cell, OPC outer pillar cell, OHC outer hair cell, DC Deiters’ cell.
Fig. 6
Fig. 6. Otitis media, and alterations in motile cilia in the absence of TUBB4B.
A Images of the tympanic membrane from 1-month-old Tubb4b−/− and control littermate. Scale bar = 0.5 mm. The tympanic membrane is denoted with an asterisk. B Cross-section of auditory bullae from 1-month-old Tubb4b−/− and control littermate, stained with Hematoxylin and Eosin (H&E). Scale bar = 100 μm. Top panel: Magnified view of ciliated middle ear epithelium near Eustachian tube (ET). Scale bar = 10 μm. Bottom panel: Magnified view of ciliated middle ear epithelium in the dorsal region of the middle ear cavity (MEC). Scale bar =  10 μm. Black arrowheads point to the shortened cilia; black arrow points to the cells missing cilia in the Tubb4b−/− middle ear. Effusion in the MEC is marked with a black star. C Cross-section of auditory bullae at P10 (top) and P15 (bottom) from Tubb4b−/− and control littermate, stained with H&E. Scale bar = 50 μm. D Ciliated middle ear epithelium near ET stained with TUBB4 (green) and acetylated tubulin (magenta, cilia marker) antibodies and DAPI. White arrowheads point to the shortened cilia in the Tubb4b−/− middle ear. Scale bar = 10 μm. D’ Ciliated middle ear epithelium in the dorsal region of the MEC stained with TUBB4 (green) and acetylated tubulin (magenta) antibodies and DAPI (blue). White arrowheads point to the shortened cilia; white arrow points to the cells missing cilia in the Tubb4b−/− middle ear. Scale bar = 10 μm. E Scanning electron microscopy (SEM) of the middle ear near the ET from P10 Tubb4b−/− and control littermates. White arrowheads point to the shortened cilia in the Tubb4b−/− middle ear. Scale bar = 5 μm. F Magnified SEM view of ciliated cells in the middle ear of Tubb4b−/− at P10. White arrowheads point to the shortened cilia in Tubb4b−/− middle ear. Scale bar  = 2 μm. ET Eustachian tube, MEC middle ear cavity, Co cochlea.
Fig. 7
Fig. 7. TUBB4B is not essential for vision in mice.
A Representative scotopic (rod) ERG responses in Tubb4b−/− mice (red) and Tubb4b+/+ littermates (black) at P126. Flash intensity = 0.059 cd*s/m2. B Representative photopic (cone) ERG responses in Tubb4b−/− mice (red) and Tubb4b+/+ littermates (black) at P126. Flash intensity = 23.9 cd*s/m2. C Flash intensity-response relationships for scotopic (rod) a-waves, recorded from P50 to P150. Tubb4b+/+ is shown in black (n = 5) and Tubb4b−/− is in red (n = 10). The dose-response relationship was fitted with the Hill equation, with maximum amplitudes determined as 364 ± 32 and 420 ± 88 µV for +/+ and −/−, respectively. Statistical analysis performed using two-way ANOVA with a post hoc Tukey test showed no significant differences (ns). D Flash intensity-response relationships for photopic (cones) b-waves, recorded from P50 to P150. Tubb4b +/+ is shown in black (n = 5) and Tubb4b−/− is in red (n = 10). The dose-response relationship was fitted with the Hill equation, with maximum amplitudes determined as 113 ± 2, 114 ± 1 µV for +/+ and −/−, respectively. Statistical analysis was performed using two-way ANOVA with a post hoc Tukey test, which showed no significant differences (ns). E Retinal cross-sections from 6-month-old Tubb4b+/+ and Tubb4b−/− littermates, stained with hematoxylin and eosin (H&E) stain. Scale bar = 25 µm. Data are presented as mean ± SEM. GCL ganglion cell layer, INL inner nuclear layer, ONL outer nuclear layer.
Fig. 8
Fig. 8. Upregulation of TUBB6 in Tubb4b−/− murine retina.
A Relative mRNA levels of β-tubulin isotypes in retinal tissues from 1-month-old Tubb4b+/+ and Tubb4b−/− mice, assessed by RT-qPCR. Data are presented as mean ± SEM (n = 3–4, unpaired t test, two-tailed). *P value ≤ 0.05. B Immunoblot analysis of β-tubulin isotype protein levels in retinal tissues from 1-month-old Tubb4b−/− and wildtype littermates. Antibodies used include pan-β-tubulin, TUBB2, TUBB3, TUBB5, and TUBB6-tubulin (left panel). Total protein stain of corresponding membranes is shown in the right panel (n = 5). C Quantification of β-tubulin isotype protein levels from (B), normalized to total protein. Data are presented as mean ± SEM (n = 5, unpaired t test, two-tailed). *P value ≤ 0.05. D Retinal cross-sections from Tubb4b+/+ and Tubb4b−/− littermates at 1.5 months, probed with TUBB6 (green) antibody and counterstained with DAPI (blue) for nuclei. Scale bar =  25 µm. ONL outer nuclear layer, INL inner nuclear layer, IS inner segment.
Fig. 9
Fig. 9. Species-specific differences in TUBB4B expression in mouse and non-human primate retina.
A Retinal cross-sections from 1-month-old Tubb4b+/+ and Tubb4b−/− littermates probed with TUBB4 (green), PRPH2 (magenta) antibodies along with a DAPI nuclear counterstain (gray). B Non-human primate retinal cross-sections were probed with TUBB4 (green), PRPH2 (magenta) antibodies, and DAPI (gray). Scale bar = 50 µm. OS outer segment, IS inner segment, ONL outer nuclear layer, OPL outer plexiform layer, INL inner nuclear layer, GCL ganglion cell layer.
Fig. 10
Fig. 10. Summary of role for TUBB4B in hearing.
Tubb4b knockout mice are profoundly deaf due to defects in both middle and inner ear (middle panel). In the middle ear, lack of TUBB4B leads to defective motile cilia causing otitis media, indicating an essential role for TUBB4B in motile cilia development and/or maintenance (left panel). In the inner ear, TUBB4B deficiency results in disorganized and reduced microtubules in pillar cells, suggesting a critical role for TUBB4B in providing mechanical support for auditory transmission through the cochlea (right panel).

References

    1. Goodson, H. V. & Jonasson, E. M. Microtubules and microtubule-associated proteins. Cold Spring Harb. Perspect. Biol.10.1101/cshperspect.a022608 (2018). - PMC - PubMed
    1. Barlan, K. & Gelfand, V. I. Microtubule-based transport and the distribution, tethering, and organization of organelles. Cold Spring Harbor. Perspect. Biol.10.1101/cshperspect.a025817 (2017). - PMC - PubMed
    1. Janke, C. & Magiera, M. M. The tubulin code and its role in controlling microtubule properties and functions. Nat. Rev. Mol. Cell Biol.21, 307–326 (2020). 10.1038/s41580-020-0214-3 - DOI - PubMed
    1. Roll-Mecak, A. The tubulin code in microtubule dynamics and information encoding. Dev. Cell54, 7–20 (2020). 10.1016/j.devcel.2020.06.008 - DOI - PMC - PubMed
    1. Breuss, M. et al. Mutations in the β-tubulin gene TUBB5 cause microcephaly with structural brain abnormalities. Cell Rep.2, 1554–1562 (2012). 10.1016/j.celrep.2012.11.017 - DOI - PMC - PubMed

Publication types