. 2024 Sep 14;74(1):41.
doi: 10.1186/s12576-024-00935-2.

Age-related histone H3.3 accumulation associates with a repressive chromatin in mouse tibialis anterior muscle

Affiliations

Age-related histone H3.3 accumulation associates with a repressive chromatin in mouse tibialis anterior muscle

Ryo Masuzawa et al. J Physiol Sci. .

Abstract

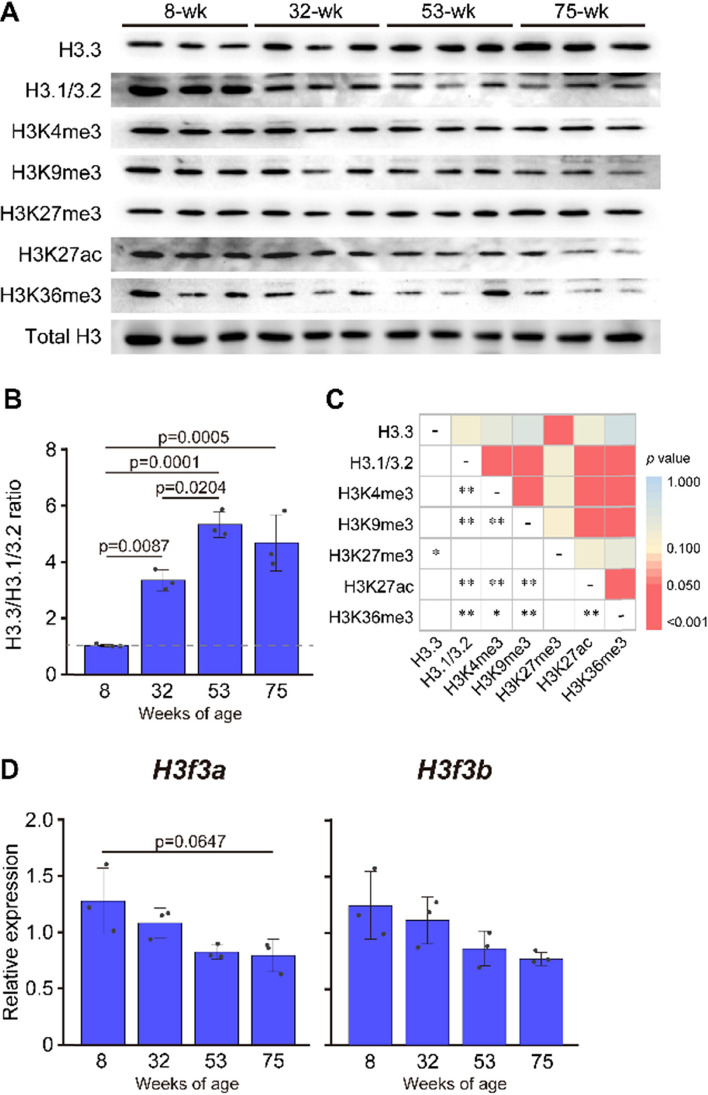
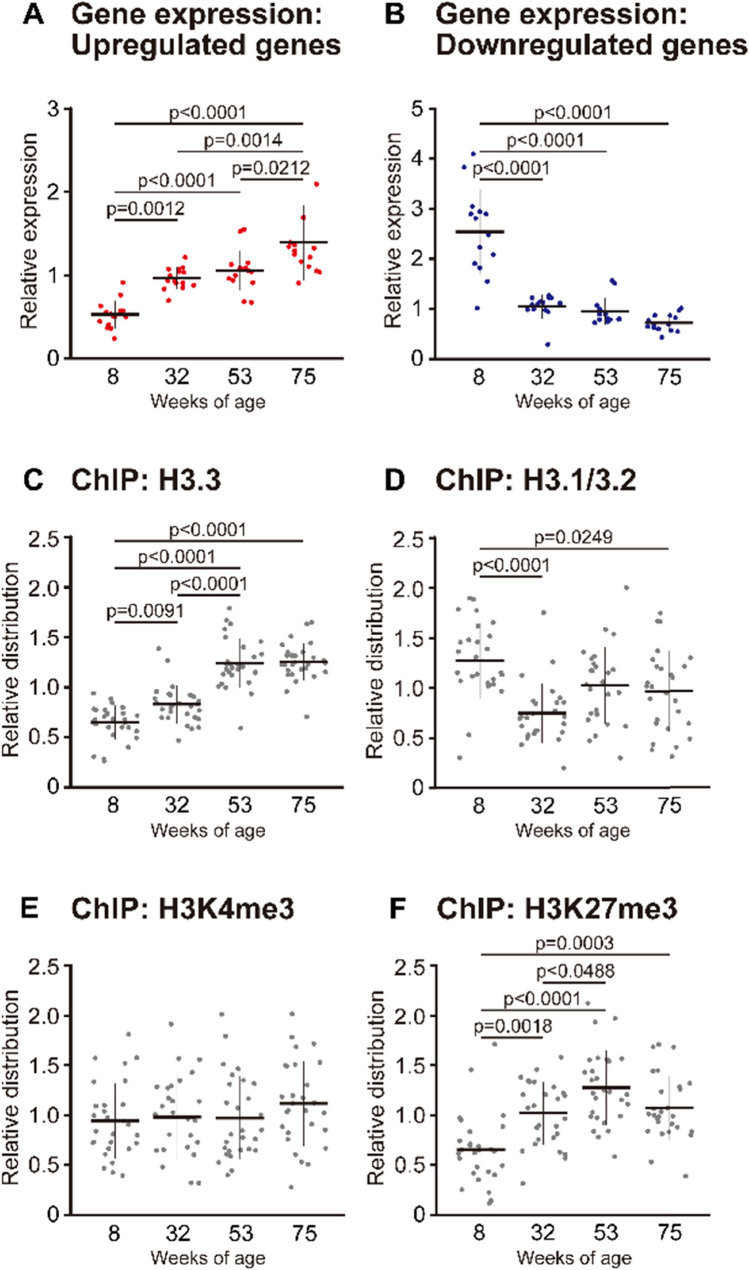
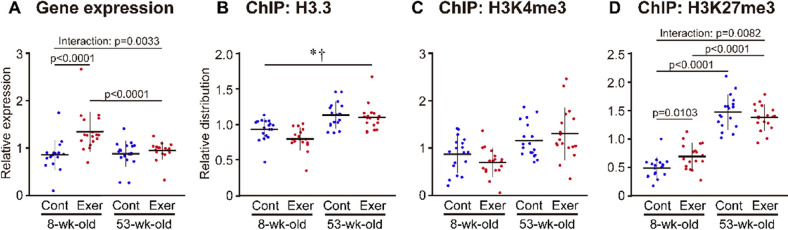
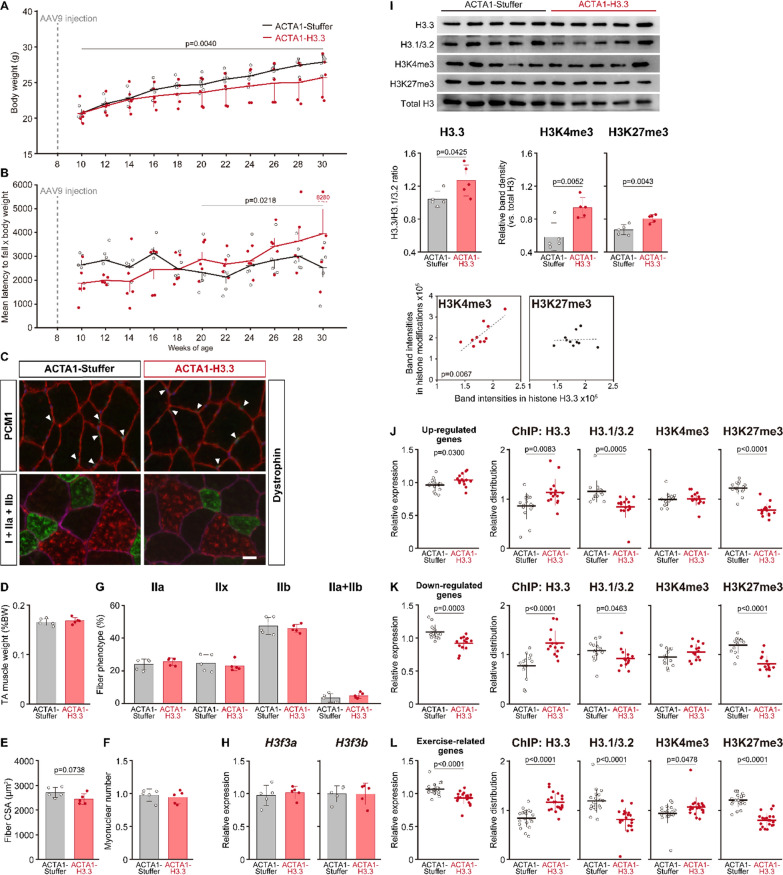
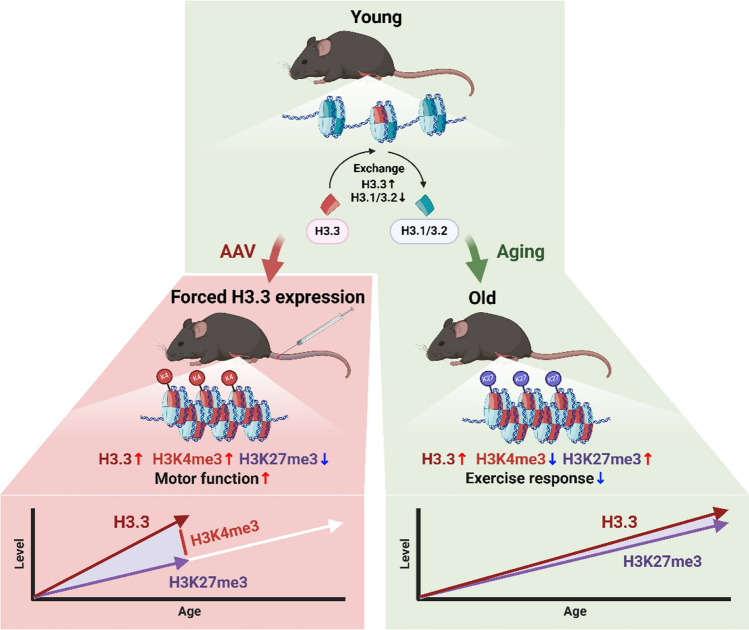
The present study aimed to investigate age-related changes in histone variant H3.3 and its role in the aging process of mouse tibialis anterior muscle. H3.3 level significantly increased with age and correlated with H3K27me3 level. Acute exercise successfully upregulated the target gene expression in 8-wk-old mice, whereas no upregulation was noted in 53-wk-old mice. H3K27me3 level was increased at these loci in response to acute exercise in 8-wk-old mice. However, in 53-wk-old mice, H3.3 and H3K27me3 levels were increased at rest and were not affected by acute exercise. Furthermore, forced H3.3 expression in the skeletal muscle of 8-wk-old mice led to a gradual improvement in motor function. The results suggest that age-related H3.3 accumulation induces the formation of repressive chromatin in the mouse tibialis anterior muscle. However, H3.3 accumulation also appears to play a positive role in enhancing skeletal muscle function.

Keywords: Aging; Chromatin immunoprecipitation; Epigenetics; Exercise; Histone modification.


Conflict of interest statement

The authors declare that they have no competing interests.

Figures

Fig. 1
Fig. 1
Age-related changes in histochemical properties of muscle fibers. Body weight (A) and tibialis anterior muscle weight relative to body weight (B) at 8, 32, 53, and 75 weeks of age. (C) Typical stained images of PCM1 (green) + dystrophin (red) + DAPI (blue) (upper panels), and type I (blue) + IIa (green) + IIb (red) myosin heavy chains + dystrophin (pink) (lower panels) at 8 and 75 weeks of age. Myonuclei are indicated by arrowheads. Scale bar = 10 µm. Mean fiber cross-sectional area (CSA) (D), myonuclear number per fiber (E), distribution of fiber phenotype (F), and CSA of each fiber phenotype (G) at 8, 32, 53, and 75 weeks of age. Data are presented as the mean ± standard deviation (SD); n = 3 in each group
Fig. 2
Fig. 2
Age-related changes in histone modifications in skeletal muscle genes. (A) Western blot analysis of H3.3, H3.1/3.2, H3K4me3, H3K9me3, H3K27me3, H3K27ac, H3K36me3, and total H3 levels at 8, 32, 53, and 75 weeks of age. (B) H3.3 to H3.1/3.2 ratio at 8, 32, 53, and 75 weeks of age. (C) Heat map showing the p values obtained using Pearson correlation between various histone modifications. *p < 0.05. **p < 0.01. See Fig. S3 for more precise data plots for the correlation of H3.3 or H3.1/32 with various histone modifications. (D) H3f3a and H3f3b mRNA expression at 8, 32, 53, and 75 weeks of age. Data are represented as the relative expression of target mRNA to Gapdh mRNA. (B), (D) Data are presented as the mean ± SD; n = 3 in each group
Fig. 3
Fig. 3
Age-related changes in gene expression and histone distribution of skeletal muscle genes. Genes that were upregulated (n = 15) (A) and downregulated (n = 14) (B) at 8, 32, 53, and 75 weeks of age. Data are presented as the relative expression of target mRNA to Rpl31 mRNA. Target genes were selected by RNA sequencing analysis. Significance of age-related change (8- vs. 75-wk-old) was confirmed in each gene by qPCR analysis (Fig. S2). Distribution of H3.3 (C), H3.1/3.2 (D), H3K4me3 (E), and H3K27me3 (F) at 8, 32, 53, and 75 weeks of age was assessed by ChIP analysis. Values are normalized to the average in each gene being taken as 1. Data are presented as the mean ± SD on the dot plots
Fig. 4
Fig. 4
Effects of acute exercise on gene expression and histone modifications of skeletal muscle genes in 8- and 53-wk-old mice. The expression of previously identified 19 exercise-related genes [11] was analyzed (A), alongside the distribution of H3.3 (B), H3K4me3 (C) and H3K27me3 (D) at these target loci using ChIP analysis. (A) Data are presented as the relative expression of target mRNA to Gapdh mRNA. (A-D) Values are normalized to the average in each gene being taken as 1. Data are presented as the mean ± SD on the dot plots. P values resulted from Scheffe’s post hoc test are shown in the figures, if a significant interaction was detected by two-way ANOVA. * and p < 0.05 in main effect of age and exercise, respectively
Fig. 5
Fig. 5
Effects of forced H3.3 expression on skeletal muscle of 8-wk-old mice. Age-related changes in body weight (A) and latency to fall in rotarod test (B) in mice with or without forced H3.3 expression. The values (time) obtained in the rotarod test were averaged in five trials and were multiplied by the respective body weight (g) to calculate the integrated values. To examine the consequence of changes in the period, the maximum length of the continuous time points from the end of experiment (30-wk-old) was selected for Student’s unpaired t test. (C) Typical stained images of PCM1 (green) + dystrophin (red) + DAPI (blue) (upper panels), and type I (blue) + IIa (green) + IIb (red) myosin heavy chains + dystrophin (pink) (lower panels) in the Stuffer (left) and H3.3 (right) groups. Myonuclei are indicated by arrowheads. Scale bar = 10 µm. (D) Tibialis anterior muscle weight relative to body weight. (E) Mean fiber cross-sectional area (CSA). (F) Myonuclear number per fiber. (G) Distribution of fiber phenotype. (H) H3f3a and H3f3b mRNA expression. Data are represented as the relative expression of target mRNA to Gapdh mRNA. (I) Western blot analysis of H3.3, H3.1/3.2, H3K4me3, H3K27me3, total H3 levels (upper images), and the quantification of each protein (bar graphs). H3K4me3 and H3K27me3 levels were normalized to the respective total H3 levels. X–Y plots show the Pearson correlation between H3.3 and H3K4me3 or H3K27me3. (JL) Changes in gene expression and the distribution of H3.3, H3.1/3.2, H3K4me3 and H3K27me3 at the upregulated (J), downregulated (K), and exercise-related (L) genes. Data were presented as the relative expression of target mRNA to Rpl31 mRNA. Values are normalized to the average in each gene being taken as 1. Data are presented as the mean ± SD on the dot plots. Biological replicates: n = 5 in each group. Bar graph present data from biological replicates, and dot plots present gene-related data
Fig. 6
Fig. 6
Hypothetical model illustrating the role of H3.3 accumulation in skeletal muscle. The right panel indicates a normal aging process of skeletal muscle, as suggested by the results in Experiments 1 and 2. The left panel shows the effects of forced H3.3 expression in the skeletal muscle of young mice. Note that H3.3 accumulation is a common result between aging and forced expression, but the role of the H3.3 increase in skeletal muscle function differs due to its modification pattern. See the Hypothetical model section for more details

Similar articles

Cited by

References

    1. Wiedmer P, Jung T, Castro JP, Pomatto LCD, Sun PY, Davies KJA, Grune T (2021) Sarcopenia—molecular mechanisms and open questions. Ageing Res Rev 65:101200. 10.1016/j.arr.2020.101200 10.1016/j.arr.2020.101200 - DOI - PubMed
    1. Lee MM, Jebb SA, Oke J, Piernas C (2020) Reference values for skeletal muscle mass and fat mass measured by bioelectrical impedance in 390 565 UK adults. J Cachexia Sarcopenia Muscle 11:487–496. 10.1002/jcsm.12523 10.1002/jcsm.12523 - DOI - PMC - PubMed
    1. Kelly TL, Wilson KE, Heymsfield SB (2009) Dual energy X-Ray absorptiometry body composition reference values from NHANES. PLoS One 4:e7038. 10.1371/journal.pone.0007038 10.1371/journal.pone.0007038 - DOI - PMC - PubMed
    1. Zykovich A, Hubbard A, Flynn JM, Tarnopolsky M, Fraga MF, Kerksick C, Ogborn D, MacNeil L, Mooney SD, Melov S (2014) Genome-wide DNA methylation changes with age in disease-free human skeletal muscle. Aging Cell 13:360–366. 10.1111/acel.12180 10.1111/acel.12180 - DOI - PMC - PubMed
    1. Voisin S, Seale K, Jacques M, Landen S, Harvey NR, Haupt LM, Griffiths LR, Ashton KJ, Coffey VG, Thompson JM, Doering TM, Lindholm ME, Walsh C, Davison G, Irwin R, McBride C, Hansson O, Asplund O, Heikkinen AE, Piirila P, Pietilainen KH, Ollikainen M, Blocquiaux S, Thomis M, Coletta DK, Sharples AP, Eynon N (2024) Exercise is associated with younger methylome and transcriptome profiles in human skeletal muscle. Aging Cell 23:e13859. 10.1111/acel.13859 10.1111/acel.13859 - DOI - PMC - PubMed